The following is a rundown of the features now available under Issues -> Stats, once you have connected your GitClear account to Jira or Github Issues.
If you have not yet connected to Jira, you're missing out on about 40% of the stats that GitClear could be calculating for you. The Jira Oauth process takes about a minute: click here to connect your entity, if you haven't already.
See also the Issue Browser help page for a granular view of what is happening during a particular sprint or timeframe.
link"Issue Stats" Tab: What's Available?
GitClear offers more than 20 different stats that pertain to issues, ticket progress, planned work, bug vs. feature, and related measurements.
linkDeveloper Work by Ticket Type
The first data point provided upon visiting the "Issues" tab is a breakdown of how much of the team's energy has been directed toward various types of tickets:
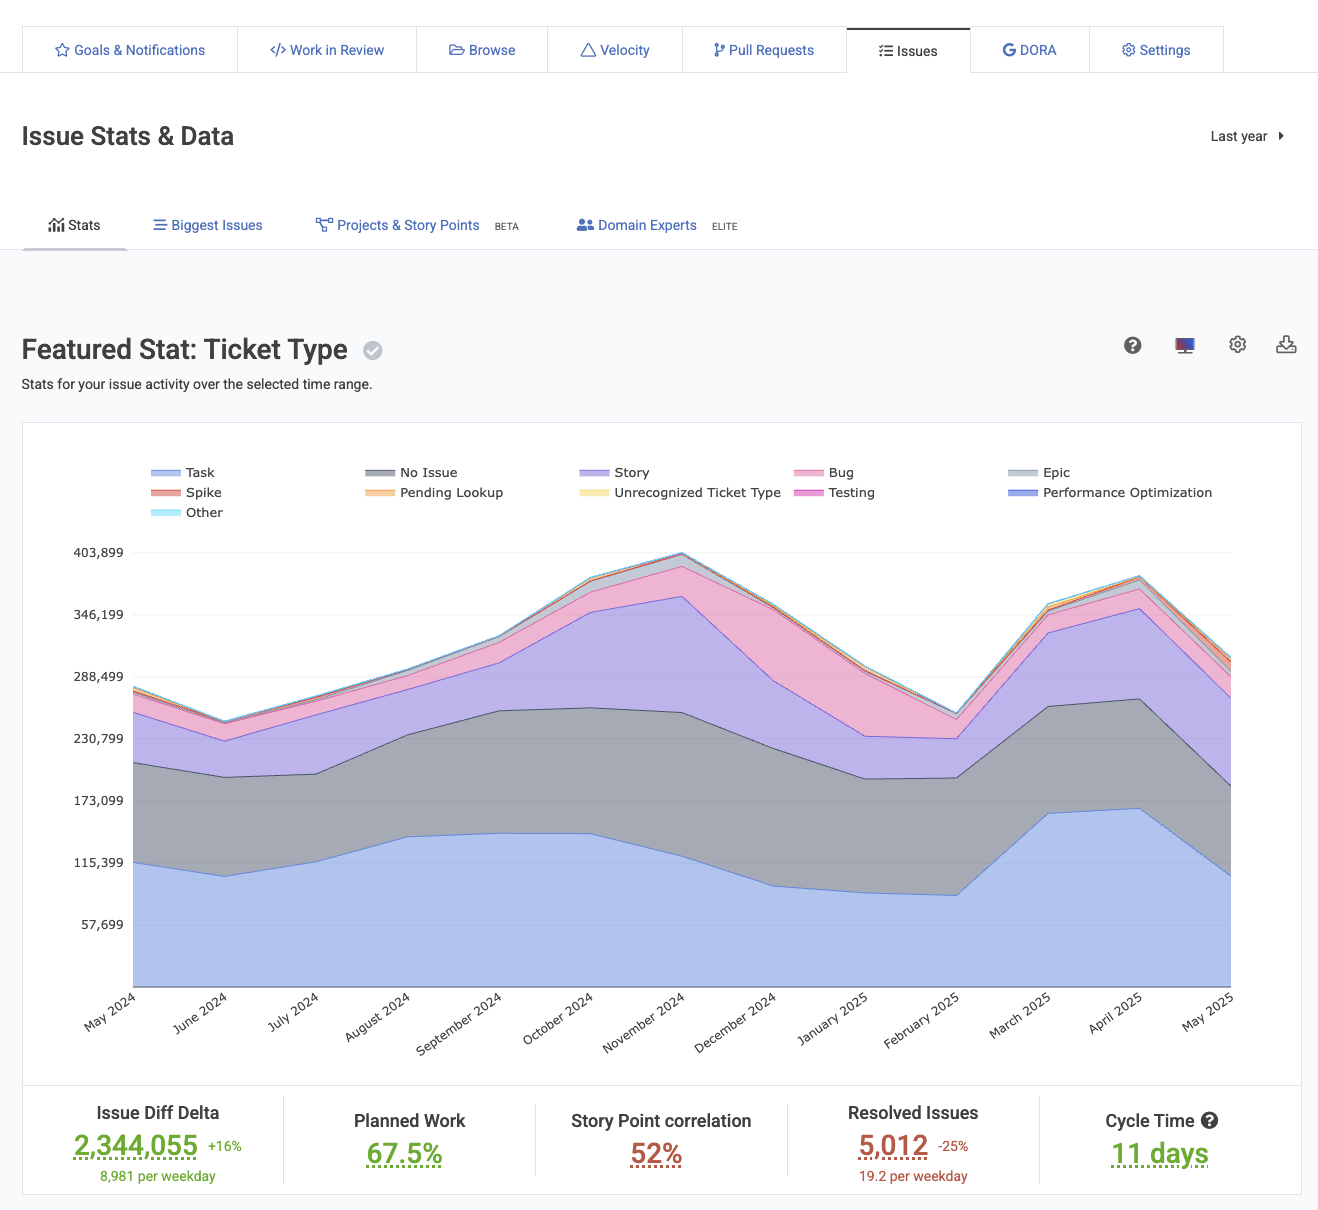
This default makes it quick to understand, on a per-team, per-developer, per-organization or per-repo basis:
What percentage of work went toward planned tasks vs spontaneous or unplanned detours? Ideally teams want to see their "No issue" percentage at 25% or less.
How much work has been spent on bug-fixing vs. feature development? This graph allows you to see, over time, how much of the selected team's energy has been spent on "features" vs "bugs" vs "optimizations." Ideally, teams want to see around 2x as much work on "Tasks" (new feature development) vs "Bugs"
What is your team's own correlation between Story Points (dev energy estimate) and Diff Delta (dev energy measurement)? Our research suggests that high-functioning teams often maintain correlation above 50% between their developer's energy expended, as measured by Diff Delta, and their estimate of developer energy, as measured by Story Points. When teams have a high correlation, it allows notifications to be generated when a ticket is consuming considerably more changed code than would be implied by the Story Point estimate.
You can hover over any of the segments to see its total percentage over the chosen time period. You can hover over a particular date to get a link to visit the issues that were active during that time frame:

Every Issue graph on GitClear is substantiated by more detailed underlying data that can be accessed
linkBug Work Percent

Which repos have had the highest percentage of bug work?
This graph makes it easy to see when a particular team or repo has experienced a spike in the percentage of work that fixes bugs. With an Elite subscription, it is possible to activate benchmark lines like the "Industry Elite Bugfix Performance" line, to see how average and "industry leading" companies perform in the amount of their work being directed toward bug fixing.
linkIssue Cycle Time
How long is it taking between when work starts on an issue, and that issue gets deployed (or marked resolved)? Issue Cycle Time has the answers, provided on a per-repo basis when viewed from an "Organization" or "Entity" context:

Viewing business days between start of work and issue being resolved or deployed
There are many who interpret Google DORA's "Cycle Time" to be equivalent to how "Issue Cycle Time" is defined. This measurement captures the interval between when an issue begins to be worked on, and when it is finally declared "done." Google says that "Elite" teams can cut this down to "1 day," but that is obviously contingent on the issue being trivial enough that it can be implemented in a day's time. Multi-story point issues obviously can't have an Issue Cycle Time that's any lower than the complexity of the issue being solved.
linkIssue Lead Time
The cousin of Issue Cycle Time, "Issue Lead Time" measures the business days that passed between when an issue opened, and when it is released/deployed.
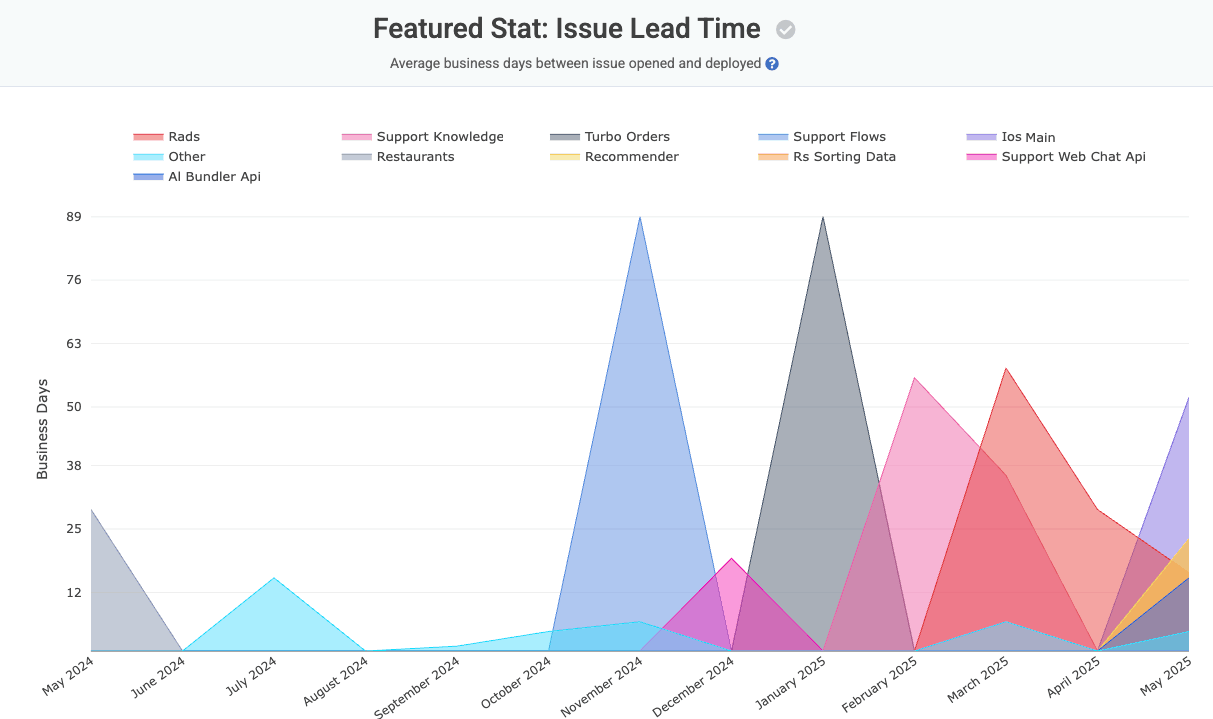
How long are issues taking to be resolved in various repos?
Each date value represents the quotient of ∑ (business days since the issues resolved today were opened) / Issues resolved today. Each issue maxes out at 100 business days that will be ascribed to it. In cases where a team revives a long-dormant issue and decides to work on it, this isn't cause to create a mega-outlier among the usual cadence between "when the issue is opened" and "when it is resolved or deployed".
To narrow down the specific issues that have dragged up your team's Issue Lead Time, you can click on a tooltip from the graph (which will drill down to show the specific issues that were resolved during the time window in question), or you can visit the Issue Browser to pick a specific project and evaluate which issues had the longest Lead Time within that project.
linkStory Points Resolved
The classic indicator of how much progress is being made across each team or repo.

Comprehensive view of how many Story Points are being resolved by the team over time
Note that you can you define different columns as the canonical "Story Point column of record," depending on the issue tracker project. It's not uncommon that our large enterprise customers utilize 3-4 different columns that reconcile as the "true estimate for how much work this ticket will require." GitClear automatically picks the Story Point column that has the greatest usage prevalence in the issue tracker project.
To see how many Story Points are being completed per active developer, see the related "Story Points per Developer" graph, available to Elite subscribers.
linkStory Points per Active Developer
For teams that are growing or shrinking in size, it's often less useful to know the gross number of resolved Story Points vs the number relative to team size. The Story Points per Active Developer show whether the average team member is succeeding at merging and deploying more work as time passes.
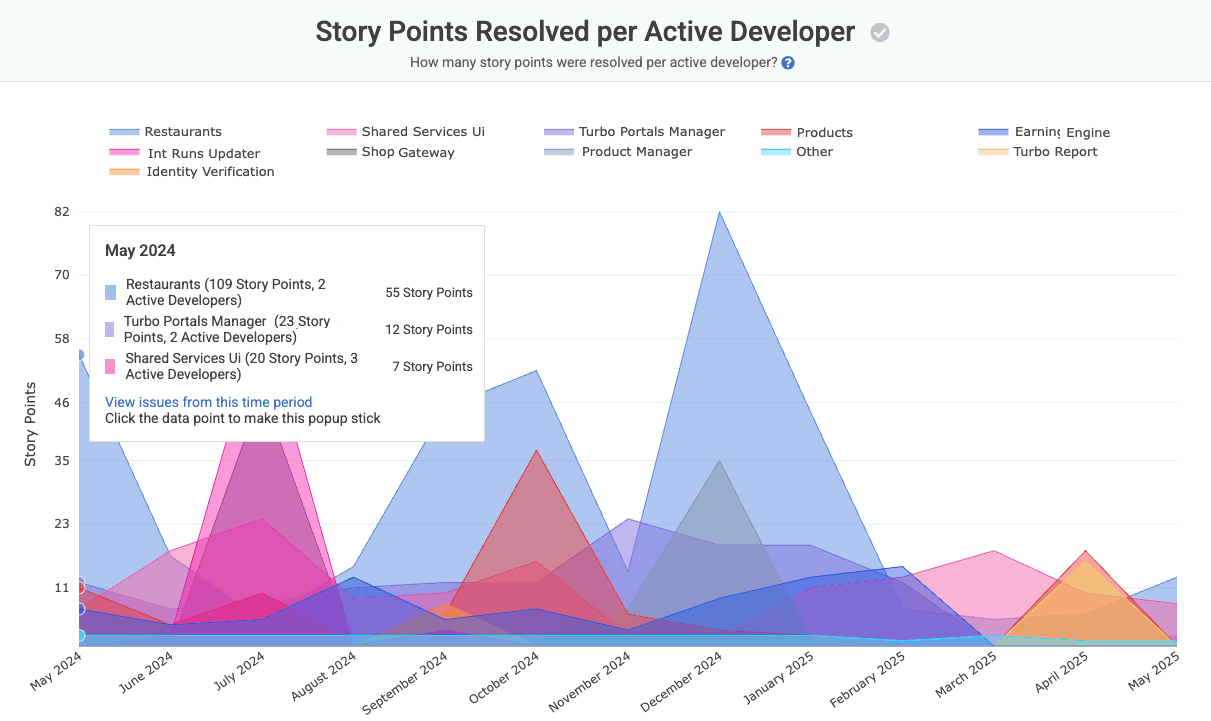
How well is the team assimilating new developers that are brought aboard?
The value for each date indicates how many Story Points were resolved on that date compared to how many developers had activity during the time interval: either by way of an issue they were working on was marked resolved, or by way of having authored a commit during that period. As with the segments, the Issue Browser is often useful when narrowing down the specific issues that had been underway during each chart date. Story Points per Active Developer are an Elite-only feature.
linkIssues Resolved per Active Developer
A high-level metric that contributes to sanity-check other metrics that illustrate the rate at which each active developer has been able to resolve issues they are assigned.
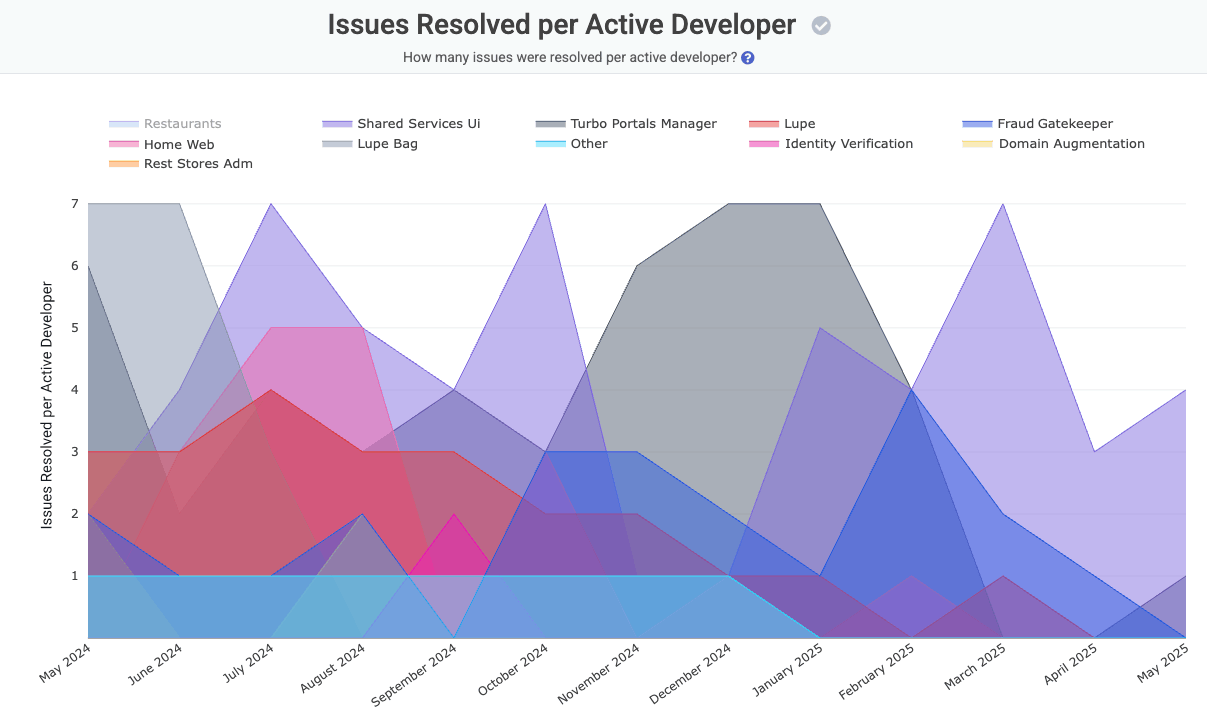
How many issues resolved per active developer per repo?
For each date interval, the total number of issues marked resolved is divided by the number of active developers within the selected team.
linkBiggest Issues Worked Lately ("By Ticket")

Seeing which issues have consumed the most developer energy
The "Progress by Issue Identifier" graph shows how much Diff Delta has been spent on various tickets over the time range selected, for the repos and team chosen.
linkIssue Tab: Browse
The "Browse" tab under "Issues & Defects" holds our "Top projects by month" table. It shows the biggest ticket that got worked on each month during the past year:

Top projects worked on in the past 12 months for Alloy. If you use Amplenote, prepare for a most spectacular leap forward in the next month or two (nominal integration with Google Calendar)
linkIssue Tab: Domain Experts
This used to be listed under "Project Tasks" when a committer was selected, but it makes more sense here. The "Domain Experts" tab helps Project Managers connect Jira tickets with the most prolific developer in the domain of the ticket. Here's how it looks for Facebook:

If you need some C++ contributed for your Facebook project, talk to Samuel. Pascal is a better fit if you're considering Android.
Filtering down to a developer or team shows how they fare across all the code 300+ code domains that GitClear currently recognizes.
linkIssue Browser & Story Point Integration
Does your team use Story Points to estimate the size of upcoming issues? GitClear will automatically calculate the correlation between your Story Point estimate and Diff Delta, which can help your team improve its estimation accuracy over time. Read more about integrating with Story Points here.

Detailed per-issue correlation between Diff Delta and Story Points offers a glimpse into which tickets most defied the team's expectations
Read more about the Issue Browser at its dedicated help page.