Comments while reviewing Google's 2026 AI ROI report:
J-Curve of AI value realization speculatively presented (without data to substantiate) on page 3
A proposed value framework for AI ROI on page 16:
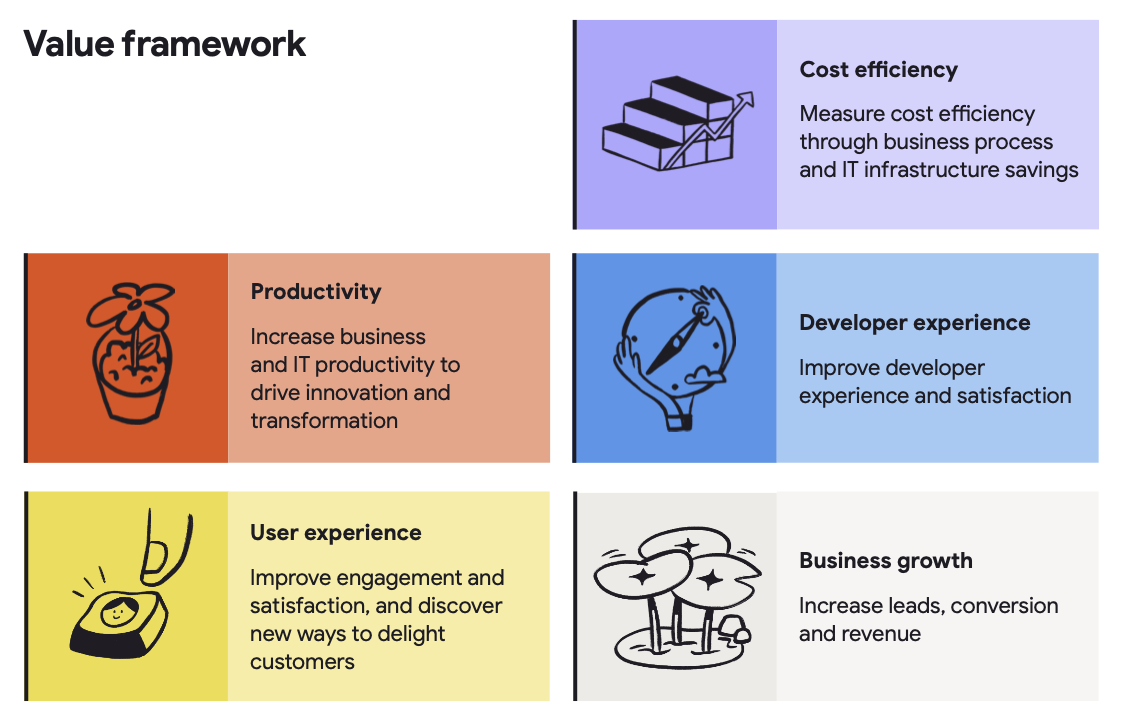
Seems consistent with what other companies recommend. The key unanswered question is "what are the 'units' of these 'values'?" That is, what specific measurements are best used to assess each? 🤞 a future page is going to answer. (They do)
Estimated effect sizes of AI impact, based on user survey:
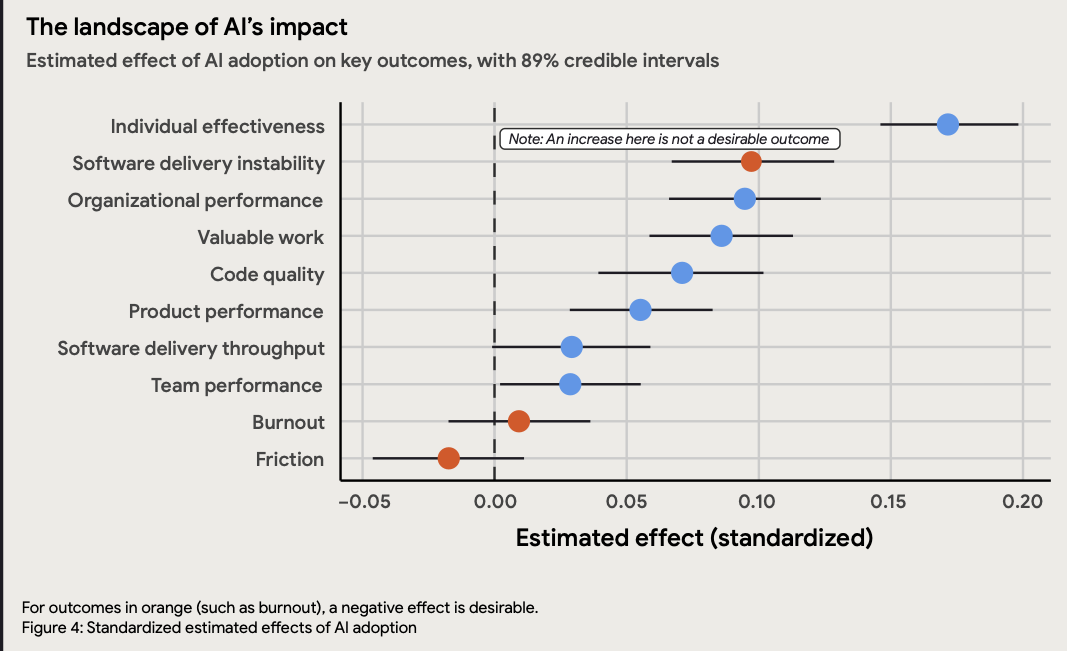
Interesting that the "Individual effectiveness" at 17% gain correlates fairly closely to the standard range of "productivity gain" that has been estimated from AI during the past year. Starting with Sundar Pichai positing 10% in June 2025, I've heard various estimates closer to 15-20% since, and little doubt that the efficacy of LLMs made a dramatic leap forward during Q4 2025.
Software instability at 10% is a very intriguing benchmark that GitClear will likely evaluate in our next AI Research report. It does feel like an axiom of sorts that "bug work" must increase if developers are habitually pushing less-thought-out code.
Organization performance increasing 9% in spite of the aforementioned reduction in delivery stability further supports the individual estimates of 15%+ improvement in effectiveness.
Code quality being overall higher, at 6%, is a fascinating one to understand. It's challenging to reconcile that "code quality is increasing, but delivery instability is increasing too." It's also somewhat difficult to intuit how, in spite of their predilection for duplication, the LLMs could ultimately write higher quality code than humans. Looking forward to seeing this one analyzed.
Team performance being only 3% higher is challenging to reconcile with organizational performance being up by almost 10%? I guess that AI could be making individual developers feel more stressed or less happy (though burnout seems unchanged in this data set), but the organization as a whole could be better off for the changes AI begets?
Methods suggested to "measure direct productivity gains" on page 24
Developer time saved. Improvements in PR Lead Time and Mean Time to Resolve reflect better individual effectiveness, better code quality, and reduced friction
Instability tax. "More unstable software is likely to detrimentally impact developer productivity because developers have to spend additional time on dealing with this increased instability."
Projecting revenue from accelerated feature delivery
How many more features can we deploy?
Idea success rate percentage of shipped features that increase revenue for the application. Research suggests this is about one third of features.
Average revenue impact per successful feature. Difficult to project, but they recommend a conservative value between 0.01% and 1%
Combining these, Revenue from accelerated delivery = (Target features deployed – Current features deployed) * Idea success percent * Revenue impact per feature * Total revenue
The report recommends a conservative range of 0.01% to 1% revenue impact per successful feature.
Combining these, Revenue from accelerated delivery = (Target features deployed - Current features deployed) Idea success percent Revenue impact per feature * Total revenue.
In the sample, (56 - 50) 33% 0.5% * $100,000,000 = $990,000 in revenue from extra feature deployments.
User experience value:
The report says better product performance should make users happier, but it treats the happiness-to-revenue link as too loose for the baseline calculator.
Instead, user experience is monetized through reduced downtime or added downtime cost.
Formula: (Current deploys Current CFR FDRT Cost of downtime per hour) - (Target deploys Target CFR FDRT Cost of downtime per hour).
In the sample, current deployments are 50/year, current change failure rate is 5%, failed deployment recovery time is 4 hours, downtime costs $100,000/hour, target deployments are 56/year, and target change failure rate rises to 6%.
The result is -$344,000 of downtime impact, because the increased change failure rate overwhelms the modest increase in delivery throughput.
This is one of the report's best numeric examples: faster delivery is not automatically better if instability rises.
Hard costs of AI adoption:
Formula: Direct hard costs = ((License cost + Additional AI costs + Training cost) * Staff size) + Additional infrastructure costs.
Sample inputs:
Annual AI license cost per user: $250.
Additional annual AI costs per user: $80.
Annual training costs per user: $9,600.
Technical staff size: 500 FTE.
Additional annual AI infrastructure costs: $100,000.
Sample result: $5,065,000 total hard costs.
The notable implication is that training/change management dwarfs license cost in the sample model.
J-Curve cost:
Formula: J-Curve cost = Staff size Salary J-Curve drop * J-Curve duration / 12.
Sample inputs:
Technical staff size: 500 FTE.
Average fully loaded technical salary: $176,000.
J-Curve productivity drop: 15%.
J-Curve duration: 3 months.
Sample result: $3,300,000.
This is the report's most useful hidden-cost line item. It makes the early adoption dip concrete enough for finance discussions.
Total first-year investment:
Formula: First year investment = Direct hard costs + J-Curve cost.
Sample result: $5,065,000 + $3,300,000 = $8,365,000.
Rounded in narrative form as $8.4M.
The investment model deliberately includes both visible spend and temporary productivity disruption.
First-year ROI calculation:
First-year return: $11,646,000.
First-year investment: $8,365,000.
First-year benefit: $3,281,000.
ROI: 39%.
Payback period: 0.7 years, or about 8 months.
Formula: ROI = (Value - Investment) / Investment.
Formula: Payback period = First year investment / First year return.
Scenario modeling:
The report recommends avoiding single-point estimates by applying multipliers to both value and cost.
Conservative scenario:
Value multiplier from 0 to 1, example 0.8.
Cost multiplier higher than 1, example 1.5.
Realistic base scenario:
Value multiplier 1.0.
Cost multiplier 1.0.
Optimistic scenario:
Value multiplier higher than 1, example 1.2.
Cost multiplier from 0 to 1, example 0.8.
This is a practical way to discuss AI ROI with finance because it foregrounds uncertainty instead of pretending the calculator is precise.
External benchmark numbers cited by Google:
Google Cloud customers are cited as finding an average 727% return over three years on Google Cloud AI investments.
Google cites a recent global benchmark that the average payback period for businesses adopting AI tools is about 8 months.
The report suggests 6-9 months as a highly successful payback benchmark for agile teams.
The report suggests 12-18 months as acceptable for larger enterprise rollouts that require heavier governance.
Stanford HAI is cited for raw inference costs for advanced models falling by a factor of 280 between November 2022 and October 2024.
The practical implication: model inference cost is becoming less central than governance cost, workflow adaptation, verification, and upskilling.
Greenfield vs. brownfield productivity benchmark:
Google cites research indicating AI yields 35-40% productivity gains on simple greenfield tasks.
The same section says complex legacy brownfield work can see gains of 10% or less.
This is highly relevant to evaluating engineering-team AI ROI: measuring only greenfield coding tasks will overstate expected enterprise gains.
The actual ROI depends heavily on codebase maturity, test coverage, internal documentation, and review/deployment automation.
Sample calculator numeric table from page 58:
Organizational metrics:
Technical staff size: 500 FTE.
Average fully loaded technical staff salary: $176,000.
Baseline software delivery metrics:
Product portfolio revenue: $100,000,000.
Cost of downtime per hour: $100,000.
Current deployments per year: 50.
Current features deployed per year: 50.
Idea success rate: 33%.
Average revenue impact per successful feature: 0.5%.
Current change failure rate: 5%.
Failed deployment recovery time: 4 hours.
AI estimates:
Net time saved per developer: 12.5%.
Annual AI license cost per user: $250.
Additional annual AI costs per user: $80.
Additional annual AI infrastructure costs: $100,000.
Annual training costs per user: $9,600.
Target deployments per year: 56.
Target features deployed per year: 56.
Target change failure rate: 6%.
J-Curve productivity drop: 15%.
J-Curve timeline: 3 months.
Costs:
Total hard costs: $5,065,000.
J-Curve cost: $3,300,000.
Total first-year investment: $8,365,000.
Value:
Headcount reinvestment capacity: $11,000,000.
Revenue from extra feature deployments: $990,000.
Downtime impact: -$344,000.
Total first-year value: $11,646,000.
Summary:
First-year benefit: $3,281,000.
ROI: 39%.
Payback period: 0.7 years.
Financial value of experiment frequency:
The report's most interesting strategic idea is that AI lowers the cost of creating software options.
In finance terms, each prototype or experiment is an option: a small investment that creates the right, but not the obligation, to make a larger future investment.
AI lowers the option premium by making it cheaper to create prototypes and variations.
The organization should only "exercise" the option by maintaining, scaling, and securing the code after user behavior proves the idea has value.
This is a strong way to connect AI-assisted development with user-centric product discovery.
Most important practical takeaways for GitClear:
AI ROI cannot be credibly measured from code volume alone.
The value metric needs to distinguish generated code from durable, reviewed, deployed, and non-reworked code.
The strongest AI ROI model measures the full chain: AI usage -> code changes -> review burden -> deployment throughput -> instability -> rework -> durable product value.
GitClear's opportunity is to make the report's abstract calculator empirically observable through commit heuristics, AI usage APIs, PR/review telemetry, and longitudinal code survival.
The Google model implicitly needs a system that can quantify whether AI-created work becomes durable engineering capacity or downstream rework. That is exactly where developer analytics can add rigor.
Bottom line:
Google's report is not saying "buy AI tools and get ROI."
It is saying that AI creates ROI when the organization can convert faster local coding into stable delivery, reduced rework, better product experiments, and reinvested engineering capacity.
The largest upside is reclaimed capacity.
The largest near-term cost is the J-Curve.
The largest operational risk is the instability tax.
The most important long-term determinant is the maturity of the engineering system around the AI.