For as long as there have been computer programmers, there have been stupid metrics used to measure them. Maybe this blog can make 2021 a little less stupid? We want to arm managers with enough technical understanding to see through the flimsy justifications for metrics like "commit count." In choosing the list that follows, we focused on selecting metrics with the highest overlap between "often used in the real world" and "irrelevant or misleading to evaluate developer performance."
In fairness to the bad metrics we're about to take down, many of them are rich in signal. These metrics could tell you something interesting — if not for the ocean of noise through which they float. The closest analog for a metric like "code churn" might be: if you walked into a room with 25 radio stations playing through a wall of speakers, that’s a lot of signal available! But what could you hope to glean from the sum of it? Approximately nothing. The noisier the data source used to justify decisions, the more arbitrary the decisions' outcome, the greater a disservice to a company's long-term wellbeing.
The first and simplest of these metrics is also the most pathetic.
linkLines of Code (LoC)
The Original Code Metric™️... that set us back decades. This metric takes a seed of signal and covers it in a thick wrapper of noise. To get more specific, here are some of the worst polluters of LoC, as classified by GitClear's analysis of ~1 million open source commits:

Explanation of terms and methodology used by the pie
As this breakdown shows, intrinsically, lines of code is about 70% noise. But it gets worse. About 30% of all commits in open source repos are eventually discarded without being merged to master, so any LoC accrued from these commits adds to the noise. If you take LoC's intrinsic 30% signal and reduce it by half to account for the purged commits in an average commercial repo, it implies something on the order of 80% noise for this metric. Yikes.
Making decisions based on a metric that's 80% noise sounds pretty bad. But LoC is still worse than that, because we haven't yet accounted for the tendency of LoC to spike when a new feature is being implemented. Incentivizing the rapid addition of code is a slippery slope into a code base addled by tech debt. Not to mention that a line of code authored in a CSS file is a far different amount of work than a line of code authored in a Java file. The average developer might write 10 lines of CSS in the time it takes to write a single line of Java, Python or Ruby, given CSS' tendency to produce short, repetitive lines of code. Thus, the "most valuable developer" as measured by LoC tends to be whoever is adding the most CSS, whitespace, and third-party libraries. 🤦♂️
For all of these reasons, lines of code stands alone atop this steaming pile of worst developer metrics. While it does harbor a glimmer of signal lurking deep within it, you'd be hard-pressed to find a metric more polluted by extraneous noise.
linkCommit Count
As with lines of code, the longevity of "commit count" as a metric used by GitHub et. al is owed largely to the relative ease of extracting it. But, it does have advantages over LoC. First, it’s not susceptible to noise by way of trivial line changes. That gets you past about half the problems with LoC. Second, it is generally true that if a developer hasn't made a commit in 2-3 days, that is often a signal that they may be stuck. So far so good.
Unfortunately, the practical utility of commit count as a software metric ends there. Whereas LoC was a signal-bearing metric undone by noise, commit count possesses virtually no signal from the outset. Why? Because, conceptually, a commit represents nothing more than a "save point" in a developer's work. How often will a developer save their work? Personal preference. If you use "commit count" as a metric to compare your developers (as GitPrime's UI encourages), you are in essence incentivizing them to cultivate a personal preference for making a commit every time they author a line of code.
Of course, it's extreme to suggest that this incentive will cause a team's developers to make a commit every time they change a line of code. But what if a developer decided instead to commit work once per hour, regardless of what they'd worked on? Conscientious developers would avoid this (perfectly logical) strategy in order to avoid drawing the ire of their teammates. But is that the position you want to put your developers in? If you're a hard-working developer that's striving to solve as many Jira issues as possible, how would you feel knowing that by simply saving their work more often, your lazier coworker will shoot past you on the commit count leaderboard?
Commit count creates a toxic atmosphere among developers who know it is being taken seriously by their manager. A programmer can easily "play the game" to commit hourly. Bad incentives lead to bad outcomes.
Developers that refuse to game this most game-able of metrics will be left constantly wondering how far they're getting behind their less scrupulous peers.
linkIssues Resolved aka “Shipping Velocity”
This metric has more promise than the other two in that it is connected to a meaningful output: an issue being solved in the issue tracker like Jira or Github. So far so good -- at least it's measuring a meaningful quantity. Now let’s try it in the real world.
If you compare the biggest and smallest task among your 10 most recently closed issues, how great is the difference in implementation time between them? We’ll break the paragraph to give you a chance to think about going to check your own data to confirm the answer, it should only take 2 minutes...
If you’re like most teams, the difference is probably 10x or more. For example, looking over the ten most recent Jiras resolved on our product, the fastest of these took 15 minutes. The longest has taken two weeks and is still ongoing. If one engineer is responsible for a domain where bite-sized tickets are prevalent (e.g., because QA tends to file a lot of small UI tickets), that’s a big problem for the backend developer who is asked to tackle a two week epic that reworks infrastructure. Is the UI developer more valuable because they happen to work in a niche where small tickets are more prevalent? Of course not. So, on any short-to-medium time scale, this metric best tracks the extent to which a developer manages to get assigned simple tickets.
We can improve the quality of "issues resolved" as a metric if we combine it with the use of "story points," but this approach has its own set of drawbacks.
linkCode Churn aka "Efficiency"
We have arrived at the most modern metric in this rogues' gallery of selections. Code churn features prominently into the offerings of both GitPrime and Velocity. The failure of code churn as a metric lies in its resistance to being consistently interpreted. GitPrime’s own blog post, “6 Causes of Code Churn and What You Should Do About Them,” provides a perfect reference source to substantiate how code churn earns its way onto this list. The causes of it, as enumerated by GitPrime, are: unclear requirements, indecisive stakeholder, difficult problem, prototyping, polishing, and under-engagement.
Let's plot these six causes on a graph with axes to clarify the implications of each:
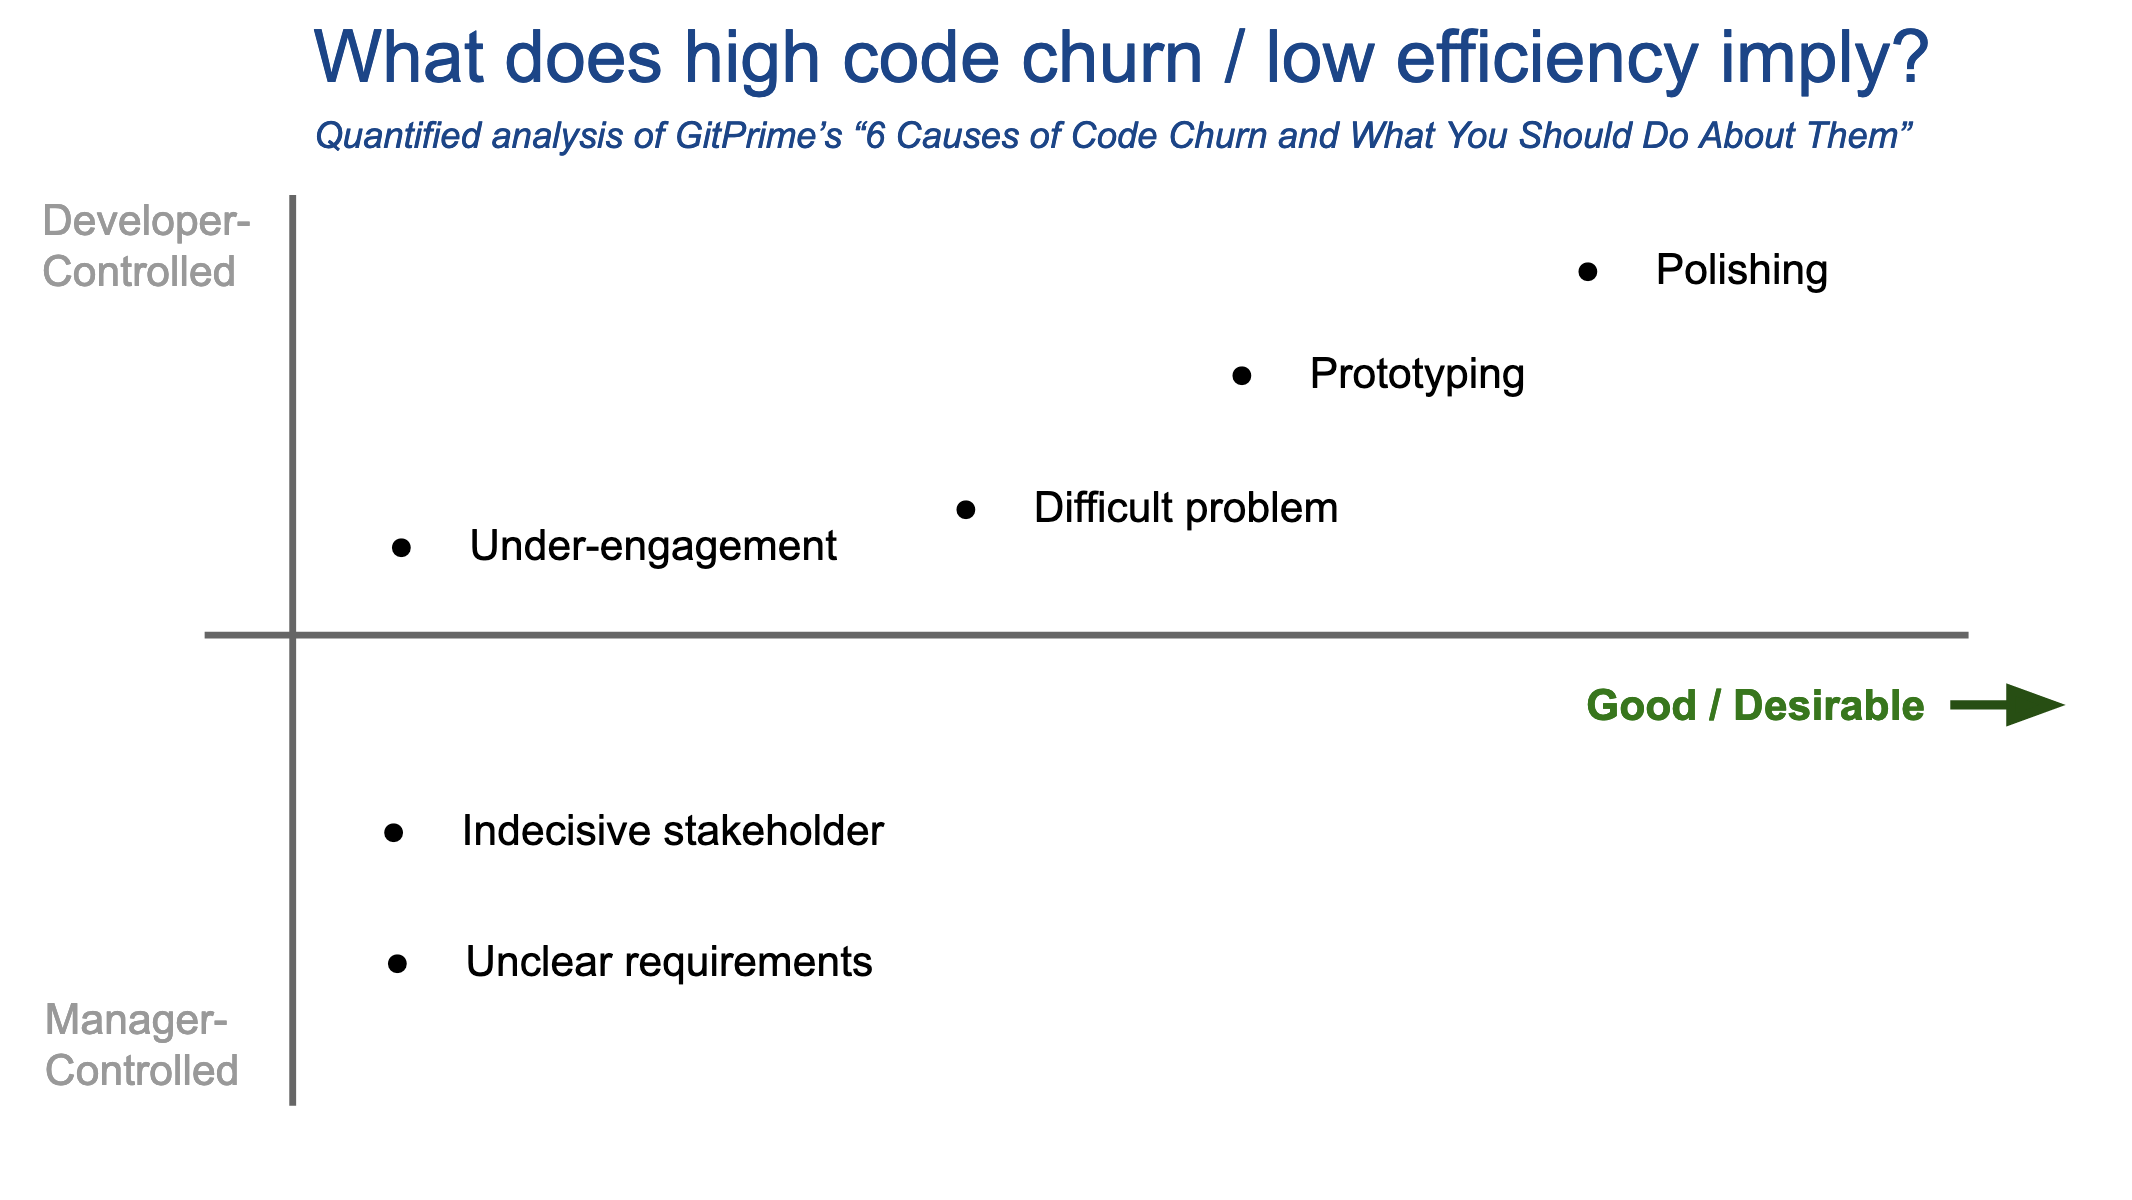
So, when code churn gets high, do you hit the panic button, or the accelerator? The answer is complicated, because there are so many disparate causes that underly code churn. From the graph above, the three causes of churn most attributable to the developer look to actually be good outcomes -- that is, most companies benefit from polished products that were prototyped in the early stages. "Working on a difficult problem" is often essential to making progress toward an audacious end.
But if code churn is so often a positive outcome, why is its inverse, "Efficiency," one of the core metrics used by GitPrime? Well, the other three causes are certainly undesirable. Under-engagement, indecisive stakeholders, and unclear requirements will drag down productivity. Thus, "Efficiency" is a metric that could be very useful... if we were trying to measure the work of product managers.
If we're trying to measure the work of developers, better to pick a metric that doesn't penalize polishing the code.
linkIs there a less bad option?
Considering that the metrics above are still considered viable at the dawn of 2020 proves how much opportunity still remains for managers to improve the measurement -> incentives -> long-term outcomes achieved by their team. To their credit, the instinct that leads managers to utilize these metrics is sound. They know that the best businesses make their best decisions using data. But so much depends upon whether the data is any good. When you place trust in a metric like commit count, you're liable to end off worse than if you'd used no data at all (i.e., by pitting the team against one another).
Our opinion is that a less bad metric would be one that harnessed the signal lurking deep within lines of code, while rinsing away its noise. The metric would consider "issues resolved," but only after normalizing for implementation complexity, so developers that work in front-end systems don't take the lion's share of credit after resolving a myriad of tiny tickets.
It’s not a very juicy elevator pitch, but it’s accurate to say that GitClear exists because we needed to rinse the noise from the bad metrics that have been available in the past. Our flagship metric, Line Impact, isn't able to directly measure developer productivity (since no single metric ever could). But it strives to maintain a coherent viewpoint about what is being measured, and how to minimize noise in the data so as to allow better business decision-making. Especially if you work at a large company, these qualities can offer a leg up by allowing an apples-to-apples comparison across variously shaped teams and technologies. If you work at a small company, then you're like most of our current customers -- looking to get an edge via better clarity around your commit activity. Regardless of the company size, step one is to stop deluding ourselves that the metrics above will reveal something profound about a development team's work.
Want to dive deeper? Read more about why GitClear focuses on providing a single, reliable metric or biggest engineering manager timesinks.
If you'd like to give our flagship metric a try on your own repos, consider signing up for a free trial.