If you care about developer measurement, software intelligence, or happy, productive developers, the release of Google's annual "State of Devops Report" is your Super Bowl. Each year since it began in 2014, as the DevOps and Research Assessment, the report has become more polished, comprehensive, and insightful.
If you haven't already downloaded the report in full, here is Google's official download page for it. Once you're signed up, you can dig in to the contents of the PDF itself.
The full PDF spans 95 pages of highly polished graphics, data, and prose. In this article, we will summarize the key findings of the report such that you can digest them in 5 minutes.
To help readers digest this report with all haste, we will use a few conventions:
Bold to highlight key points in a sentence or section
Specific data is 100% golden. When Google cites specific numbers, it reflects their having performed novel research. This is the stuff that industry analysts, media, and smart execs pay attention to.
Rich Footnotes to allow you to see screenshots of the source material, to keep us honest as we summarize it 😅
That's enough preamble, let's summarize these 95 pages!
linkExecutive summary (page 3)
For nearly a decade, the DORA research program has been investigating the capabilities and measures of high-performing technology-driven organizations. We’ve heard from more than 36,000 professionals from organizations of every size and across many different industries.
This research uses rigorous statistical evaluation and is platform-agnostic (see Methodology).
This year’s research explored three key outcomes and the capabilities that contribute to achieving those outcomes: Organizational Performance, Team Performance, and Employee Wellbeing.
linkKey findings (page 4)
Speeding up code reviews is one of the most effective paths to improving software delivery performance. Teams with faster code reviews have 50% higher software delivery performance.
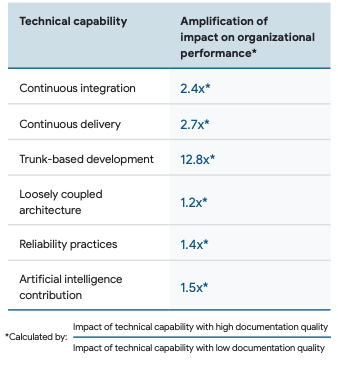
Trunk-based development, for example, is estimated to have 12.8x more impact on organizational performance when high-quality documentation is in place relative to low-quality documentation.
Underrepresented respondents have 24% more burnout than those who are not underrepresented. Underrepresented respondents do 29% more repetitive work than those who are not underrepresented. Women or those who self-described their gender do 40% more repetitive work than men.
A user focus can inform and drive improvements across all of the technical, process, and cultural capabilities we explore in our research. Teams that focus on the user have 40% higher organizational performance.
Using a public cloud, for example, leads to a 22% increase in infrastructure flexibility relative to not using the cloud. This flexibility, in turn, leads to 30% higher organizational performance than inflexible infrastructures.
linkConcepts and Measures (page 6)
Describes results of various measurements undertaken.
linkKey outcomes
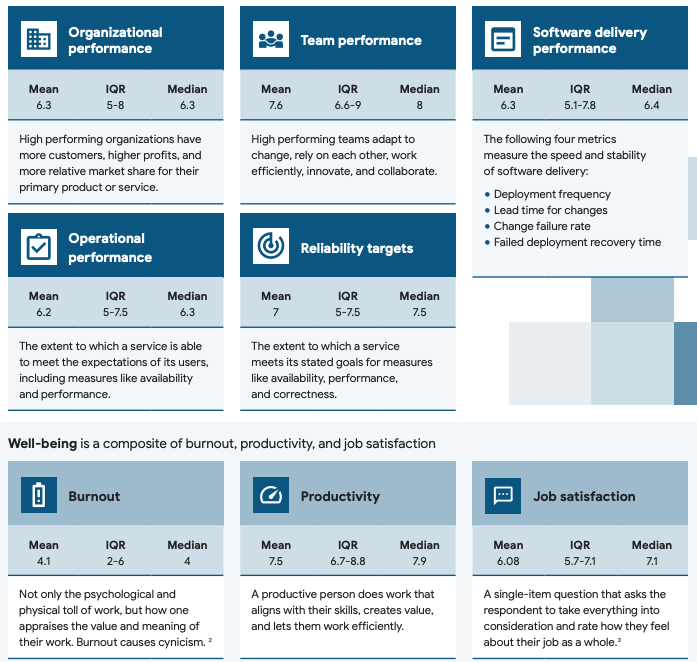
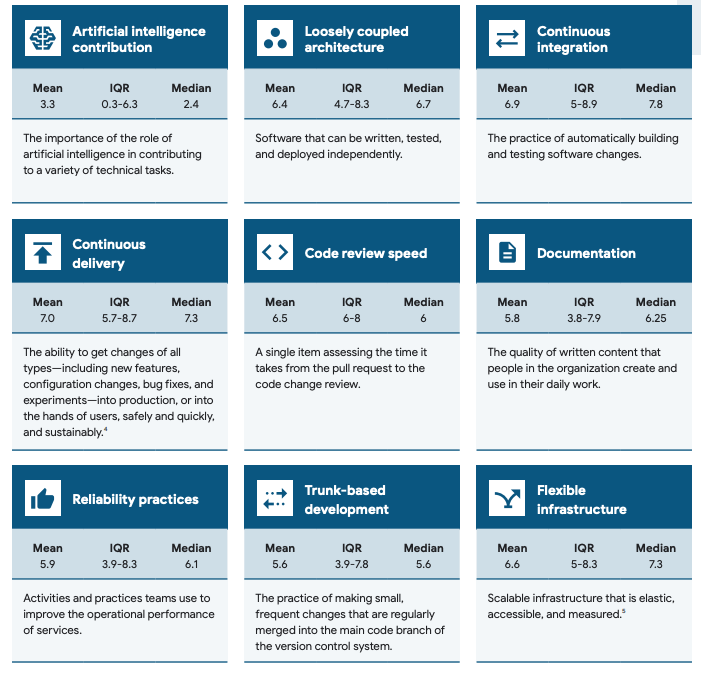
linkProcesses & technical capabilities
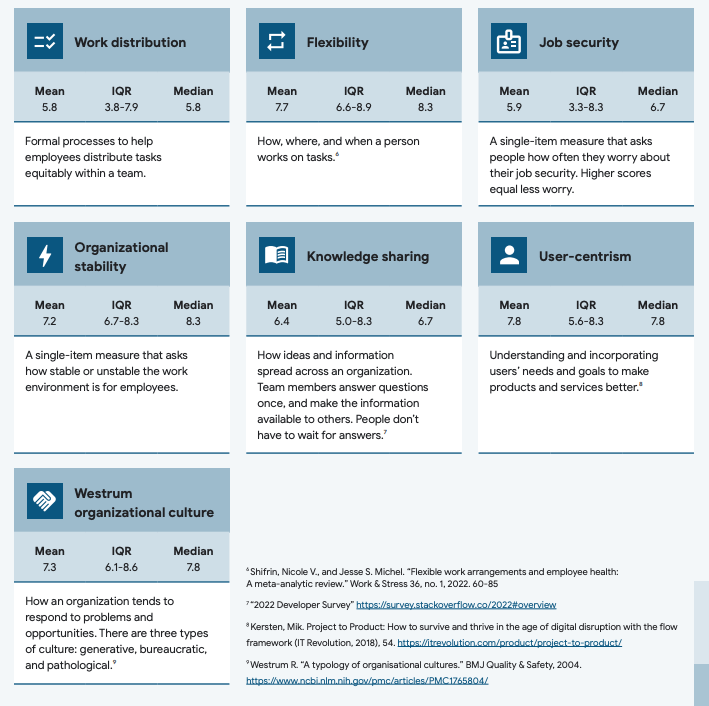
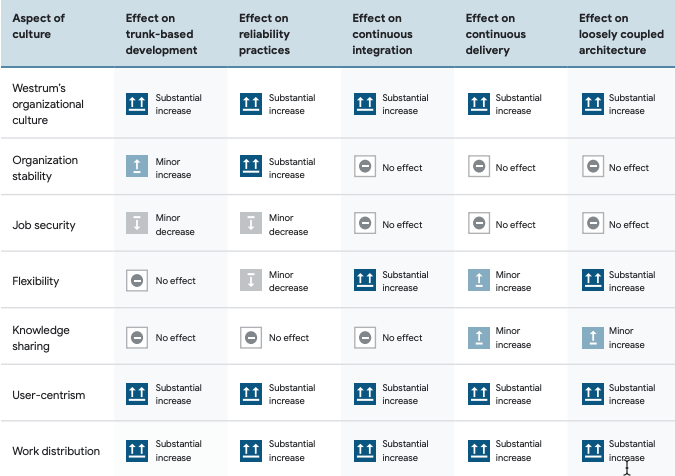
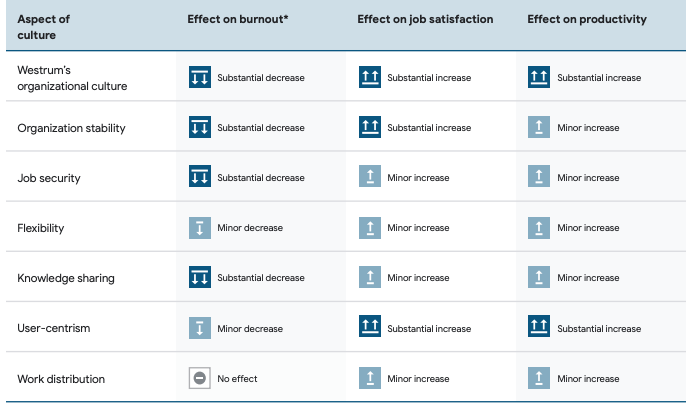
linkCulture aspects
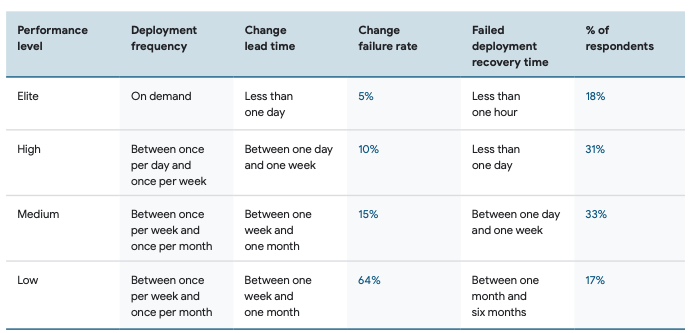
linkClassic Dora Stats (page 11)
The four DORA metrics that have been tracked since the beginning are presented in this section:
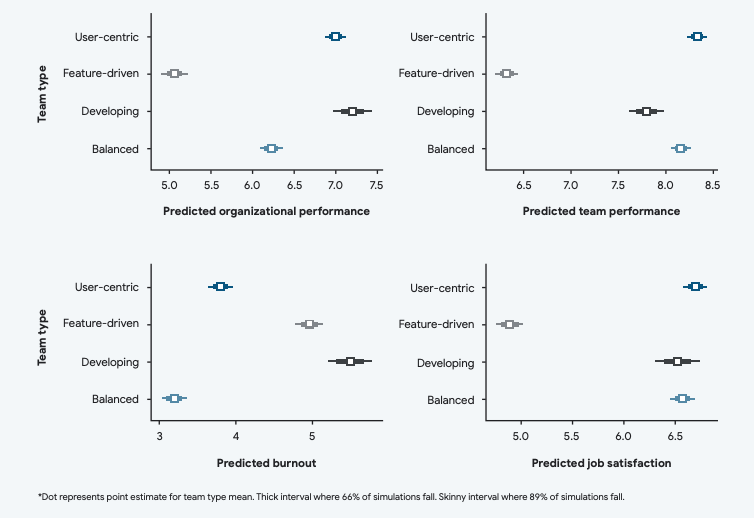
linkFocusing on users predicts organizational performance (page 17)
Headline finding: Teams with strong user-focus have 40% higher organizational performance.
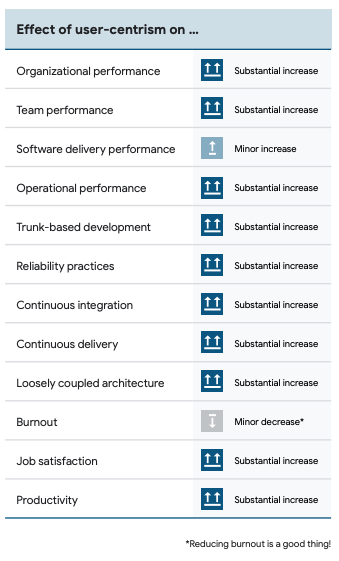
Focusing on the user leads to 20% higher job satisfaction.
linkTechnical capabilities predict performance (page 20)
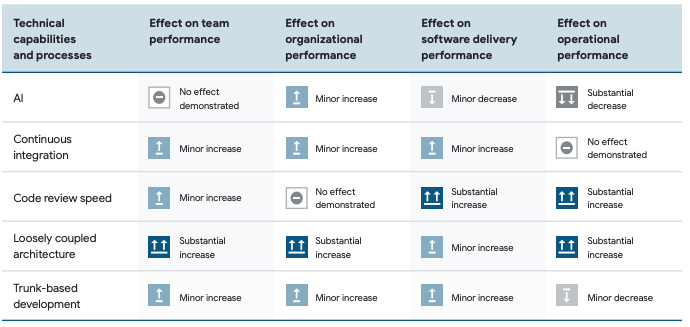
Teams with shorter code review times have 50% better software delivery performance. Efficient code review processes lead to code improvements, knowledge transfer, shared code ownership, team ownership, and transparency
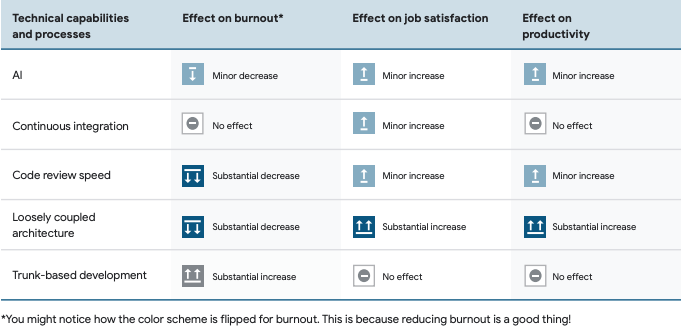
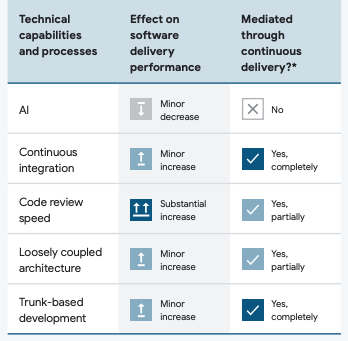
linkInfluence of AI

linkDocumentation is foundational (page 27)
Quality documentation is foundational. It drives the successful implementation of technical capabilities and amplifies the impact those capabilities have on organizational performance
Results whose effect size continues to surprise researchers, as indicated in their annotations:
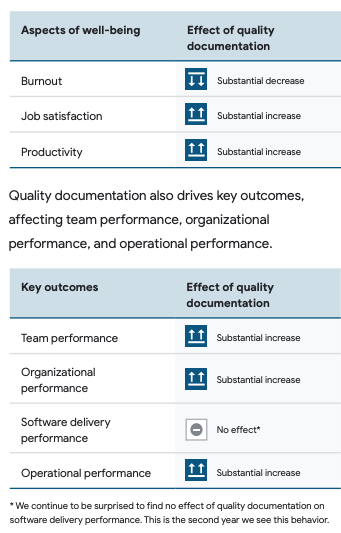
Is documentation tied to decreased well-being for underrepresented groups? More high quality documentation is somehow tied to greater levels of burnout, which is a most vexing finding, since documentation seems to be a strong net benefit.
linkReliability unlocks performance (page 31)
You might want to take a seat for this shocker: having software reliability practices apparently improves software reliability:
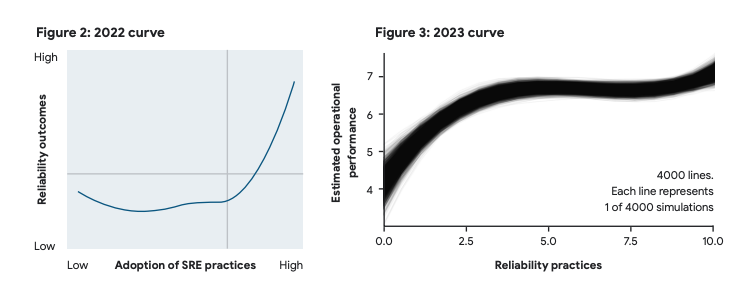
Ok, that is probably what most researchers would have guessed, but it is good to see it affirmed in graph form.
How Google does SRE: page one and page two. Summarized nicely by a passage:
A saying was born:
• SRE shall not scale linearly with the number of users.
• SRE shall not scale linearly with the number of servers.
• SRE shall not scale linearly with the number of clusters.
• SRE shall not scale linearly with the number of services.
But how did SRE scale up over time? In a word: sublinearly. That is, Google couldn’t double the number of SREs employed every time Google got two times bigger. Given the pace at which early Google products were scaling up to meet global demand (and with the introduction of new products like Gmail, Google Maps, Android, YouTube, and Google Cloud), it wasn’t possible to scale these new, scarce SREs at the same rate at which the customer base grew.
Their case study concludes: "But above all, SRE teams stick to their principles: embracing risk, measuring service levels, eliminating toil, embracing automation, and striving for simplicity"
linkFlexible infrastructure is key to success (page 38)
We breezed over this section, since the conclusion that "cloud infrastructure is beneficial" is one that Google has unlimited incentive to believe. It may well be true, but the data from this section doesn't contain anything likely to surprise you, except perhaps this passage:
We see strong indicators that public cloud leads to decreased software and operational performance unless teams make use of flexible infrastructure. This finding further promotes the idea that simply “lifting and shifting” (the act of shifting workloads from a data center to the cloud) is not beneficial and can be detrimental.
linkNone of this works without investing in culture (page 45)
Another section where current societal expectations likely influence the content of what findings would be presented (vs ignored, if data was contrary to desired outcomes).

linkHow, when, and why who you are matters (page 51)
The paper's diversity section makes the point that those who identify as "underrepresented" report doing more repetitive work. It also mentions
New hires do struggle with productivity
New hires (<1 year of experience on team) score 8% lower on productivity than experienced teammates (>1 year experience).
The results this year suggest that high-quality documentation leads to substantial impacts in productivity (see Chapter 4 - Documentation is foundational) and AI has minor benefits on an individual’s productivity (see Chapter 3 - Technical capabilities predict performance). We have no reason to expect these effects wouldn’t extend to new hires. When we look at the data, this is what we see: these practices do help new hires, but these practices do not help new hires more or less than everyone else. In other words, new hires don’t get any special benefits from these practices.
Respondents who identified as women or self-described their gender reported doing 40% more repetitive work than respondents who identified as men.
linkFinal thoughts (page 57)
The most important takeaway from our years-long research program is that teams who adopt a mindset and practice of continuous improvement are able to achieve the best outcomes.
Identify which dials need adjusting for your organization, and then make investments in those adjustments.
Share your experiences, learn from others, and get inspiration from other travelers on the continuous improvement journey by joining the DORA community at https://dora.community