Developer Analytics tools like GitClear face a vexsome problem. Their subscriptions are purchased by CTOs, VPs of Engineering and CEOs, which means that these tools face constant pressure to provide any comparative report that is requested by the subscription-deciding leaders at a company. But there is inherent tension between "creating comparative reports" and "being developer-friendly." The moment a developer has to worry that a metric can be used to judge them unfairly, the opportunity to bring that developer into a conversation about self-improvement is lost.
When a developer learns that their commit activity is being quantified, their reflexive instinct is to imagine how the measurement will misrepresent their value. Thus, we see it as incumbent upon Analytics Tools to be transparent about the steps they take to protect developers' interests. This document serves as our "Transparency Report," detailing the specific steps we take in pursuit of providing the most Developer-Friendly Analytics on the market.
linkGitClear policies promote positive use of analytics
Learn how GitClear's collection of overlapping policies prevent misuse of our signal-rich data.
linkPolicy 1: Historical stats presented by team, not committer
The first step to preventing metric misuse is our policy that historic data available to managers should be grouped by team, not individual. We believe this corresponds to the intrinsic truth that companies succeed or fail as a team -- the internet is rife with stories of valuable developers that empower their teammates to get more done at the expense of their own commit volume.
While stats default to presenting progress on a team-wide basis, users can also use the Committer List to view stats for an individual committer. When stats are filtered by developer, sensitive data is filtered unless the committer has granted access to the user trying to view the report.
See also: How to request & grant access to individual committer data for shared collaborators
linkPolicy 2: Developer-only reports promote self-directed improvement
The most common GitClear use case is that of an individual contributor that wants to experiment with different tactics to get more done in a day. For these self-driven developers, GitClear offers the option to filter any report on themselves from the team selector:
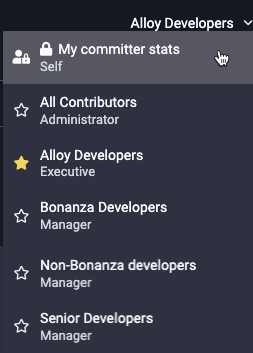
Filtering on a committer's own activity
As suggested by the iconography, a committer's personal stats are just that -- personal. There are several reports of interest for a self-focused developer, including the Hourly Impact report, the Diff Delta History report, and the "Biggest Tickets worked on" report.
linkPolicy 3: Document the limitations of Diff Delta (not a productivity metric)
Diff Delta is a metric that measures the rate of repo evolution, optionally with an emphasis on deleting code, writing tests, or removing code in legacy directories. When developers think about their greatest streaks of "productivity," there is often rapid code change entailed, but not always. And from a manager's perspective, "developer productivity" usually means that the code changes taking place are in service of the product roadmap. Diff Delta doesn't change based on these factors, which is why we have been clear since our inception that Diff Delta is not a metric that measures developer productivity.
linkWhere individual committer data is available
While we default to presenting data on a per-team basis, there are contexts where it is reasonable -- and beneficial to developers themselves -- that a Lead Developer or CTO will seek out individual data for a contributor.
The following detailed list enumerates where non-aggregated reports are (and aren't) available on GitClear.
linkReports that require developer consent for Manager access
There are two reports whose data is sufficiently sensitive that we require the developer to confirm they know & trust a teammate before availing access to the report.
Cohort Report. This report shows how quickly a developer is ramping up relative to past hires. It can be extremely useful for identifying opportunities within the onboarding process for a developer to get up to speed quickly. But since it provides a long-term-historical comparison of the developer vs. past cohorts, we require committer permission.
Industry Benchmarks. This report illuminates how a developer has performed recently compared to other companies. As with the Cohort Report, the potential for misuse leads us to label this report "sensitive data" that requires the committer to confirm they know & trust the report viewer.
linkDate-limited reports
These reports tell the story of a developer's holistic performance. In order to prevent busy managers from misinterpreting report implications, we limit the date window for these reports to the past month (for teammates designated "Developer") or quarter (for Managers, Executives, and other teammates).
Delivery Velocity. This report offers a high-level summary of how much the developers work has evolved the repos they work within. It can be useful to compare whether the past month or quarter are directionally better or worse than the quarter that preceded it, so we permit date-limited committer access without an access grant (and unlimited access with committer permission)
Pull Request Activity. The analog of "Delivery Velocity" in the sphere of pull requests. Since it shows Diff Delta by PR phase (before opened/while opened for review/after merged), it is a very powerful report. With that power comes responsibility, which is why we limit its date range when consent has not been granted.
Issue Stats. Like "Delivery Velocity," but for individual Jira tickets. Since this shows aggregated Diff Delta over a time range, it is considered sensitive data.
linkReports that permit visibility into individual performance
Each report includes a screenshot of the report for transparency, plus our reason for offering unrestricted access.
Commit Activity Browser. This page doesn't aggregate data or stats. It provides a short-term glimpse at the last few days so that the managers can keep in the loop about what projects are currently underway without having to disrupt their developers' flow state.
Directory Browser and its sibling report Tech Debt Inspector. The three most active committers in a given directory or file are shown while browsing the repo. This allows developers that are new to the repo to get a sense for who they might direct their questions toward if they are going to be making contributions in a new directory.
Pull Request Collaboration Stats. There are two graphs in the pull requests section that allow developer comparison: the "PR comments left" chart and "PR comments received" chart. These reports allow the team to get a high-level look at the collaborative practices of their team. This data does not relate to a developer's productivity, so it is visible.
Domain Experts Report. This report will list up to three developers that have made the greatest number of contributions to each code category during the selected time period. This data allows managers to get a sense for which developers might be good candidates to tackle Jira tickets that will require work in a certain language or library. It can not be used comparatively since any project will have tens of code categories, offering every developer the opportunity to shine in their niche.
linkHelp us improve?
Do you think we could do more to aid Managers that want to get the most from their team?
Are you a Developer that believes a GitClear report is too powerful to be offered without Developer permission?
Email GitClear CEO Bill Harding with your ideas on how to evolve our policies. We are making an earnest effort to strike the right balance of being fair to Developers and useful to Managers. But since there is so little precedent in this area, it's not always obvious where to draw the line. We would love to get your thoughts, if you think there is somewhere our policies could be changed for the better?