When a team connects to Jira and uses the Jira stat graphs or the issue-based notifications, they often find themselves wishing to dig deeper into what went wrong on particular issues from the past sprint, past quarter, or past year. The Issue Browser offers an interactive means to see aggregated data about all issues that were active during a given time period or sprint.
linkAccessing Issue Browser
The Issue Browser is linked from the tooltips in most graphs that feature issue-related stats. It is also linked from notifications that monitor when an issue seems to be falling behind schedule vs. its original expectation.
The browser can be accessed directly by visiting the "Issues" tab and choosing "Projects & Story Points":
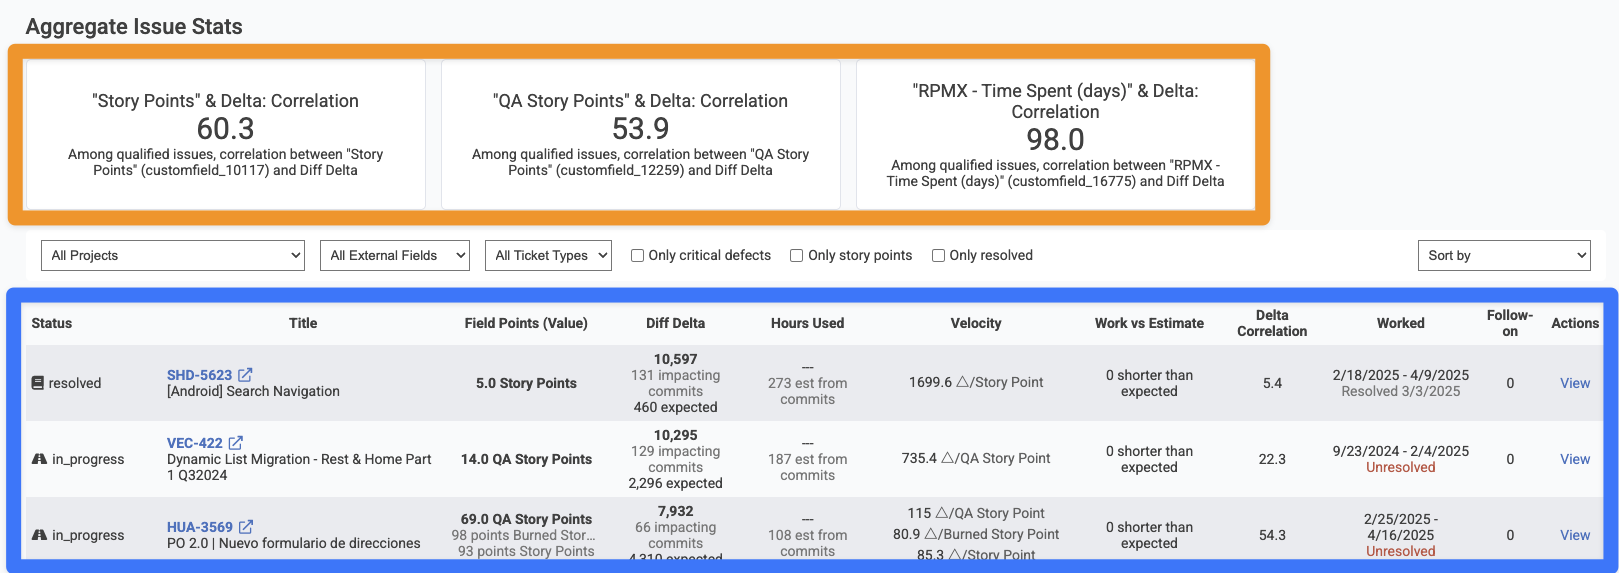
linkAggregate Issue Stats
The top section of the page, as highlighted in orange above, shows the high-level correlation between various issue fields and Diff Delta, GitClear's benchmark metric for the amount of "durable code evolution." Ideally, a team wants to see at least 50% correlation between Diff Delta and Story Points, but it's not uncommon that correlation can be as low as 10-30% if a team is working in a new code base, or if they have not fully connected & set up their GitClear repos to detect which issues have been worked on lately (basic setup, advanced setup).
To see the specific correlation between a Story Point field and Diff Delta, you can choose the field from the "All External Fields" dropdown.
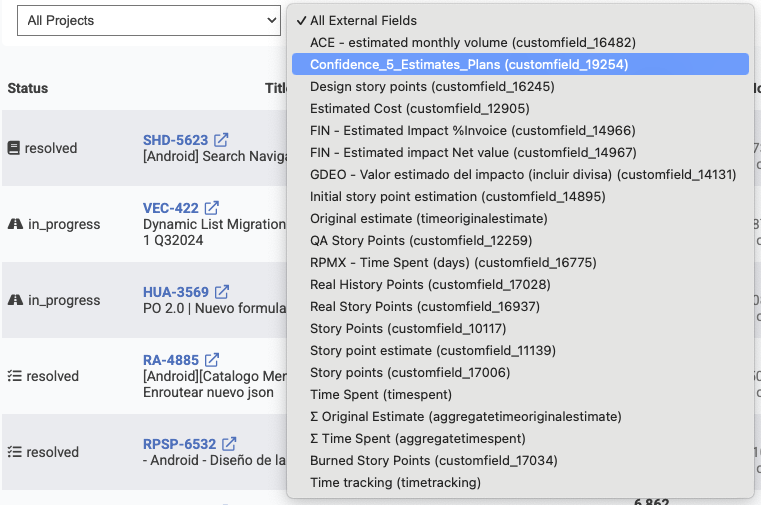
It's not uncommon for enterprise teams to use numerous columns to track various details of issue value or energy. The field selector lets you drill down on a single field.
After choosing a field, your page will automatically update to show aggregated stats (if there are enough issues with known commits to calculate it) and issues that utilize the selected column.
linkFiltering Issues
Numerous options are available to find the issues that matter most:
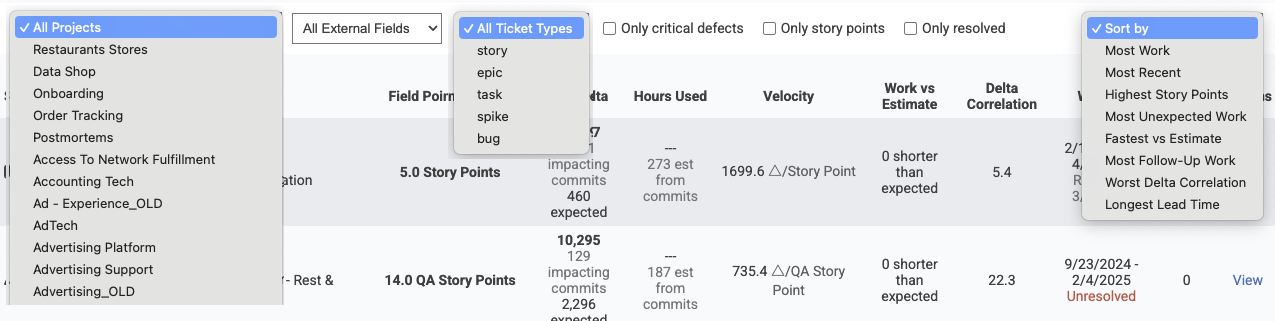
Most of these are pretty self-explanatory. The box for "only critical defects" filters only issues that were designated as an "urgent" or "hotfix"-qualified issue -- one that the team prioritized fixing as soon as possible.
The "Sort by" column is the most interesting.
linkSifting out "problem issues" with "Sort By" field
The "Sort by" column was designed to help surface issues that defied the team's expectations: either positively or negatively. Here is a brief description for each of the sort options:
Most Work. Which issues had the most Diff Delta, aka "which issues required the most significant code change to implement?" When things are going "according to plan," the top issues from this sort should represent the team's highest Story Point issues: the big bets that a team made on their project during the time analyzed. When things are going "not to plan," a team might will sometimes find issues that required thousands of Diff Delta (reminder: 1,000 Diff Delta takes the average developer around 2-3 weeks to accumulate) for what was estimated as 1-3 Story Points. This suggests that the ticket ended up being much more labor-intensive than was initially envisioned, usually because when the developer went to implement the ticket, they encountered challenges like tech debt that prevented them from implementing a simple change for what seemed like a simple challenge when the team estimated the issue's Story Points.
Most Recent. Which issues have been worked on most recently?
Highest Story Points. Which issues had the most Story Points, or the highest value of the external field that the user is filtering on.
Most Unexpected Work. Which issues had the largest gap between "How much Diff Delta seemed like it would be necessary, given the estimated Story Points?" and "How much work was actually needed to implement this ticket?" When an issue has a high amount of unexpected work, it generally signals that either the estimation process failed to fully factor in the breadth of system changes that would be necessary, OR the developer ended up needing to implement a change that was much more widespread than the team had anticipated when assigning Story Points.
Fastest vs. Estimate. The inverse of "Most Unexpected Work": which issues were estimated to be very energy-intensive, but ended up requiring less Diff Delta than expected. Assuming that the team has finished setting up the commit/issue connection,
Most Follow-Up Work. Which tickets, that included a resolved pull request, had the greatest amount of Diff Delta measured in the aftermath of merging the pull request? This "extra add-on work" usually is indicative of unexpected fixes or bugs that slipped through the pull request tests & review process.
Worst Delta Correlation. Which issues had the lowest similarity between Story Points (or the chosen external field) and Diff Delta? A mismatch between ticket value and measured developer output often suggests tech debt or opportunities to improve the effort estimation process.
Longest Lead Time. "Lead time" for a ticket is the time between when the issue was opened in Jira, and when it got deployed to production. For teams that use Jira as a repository for all their long-term ideas, it's usually not important if a low priority issue takes months or years to get worked on and deployed. But, in the context of a user filtering for "High severity" issues or filtering on a critical project, there may be an expectation that all filed issues should be worked on, merged, and deployed within a given time frame. This sort will pinpoint the issues that took longest to work through the process.
Several of the table heading columns can be clicked on, as an alternative means to apply a "Sort by" preference.
linkBrowsing Issues
As of Q2 2025, the columns in the Issue Browser are continuing to evolve. They currently include the following:
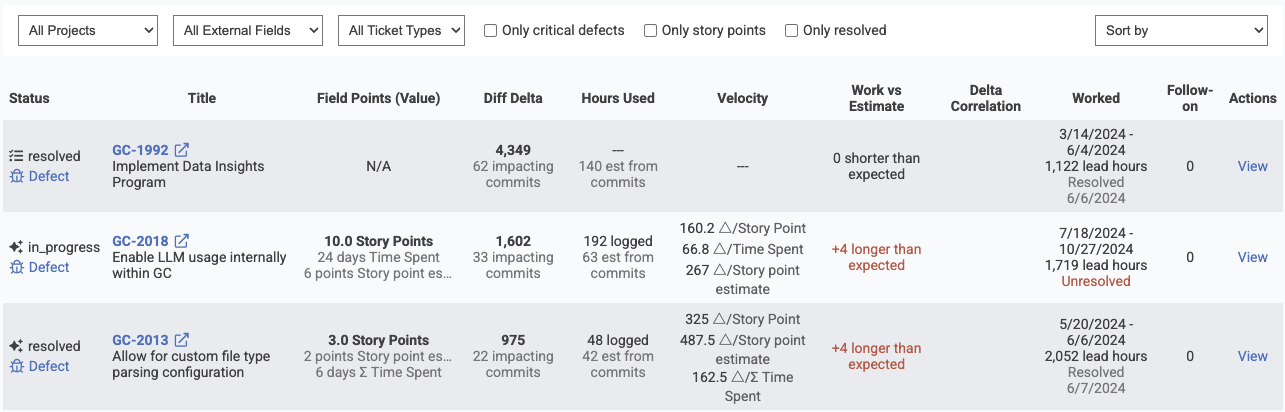
Columns shown by the Issue Browser during its active development
These columns substantiate the takeaways that a team will be looking to understand when applying the various "Sort By" modes described above.