Research on how to create a concise infographic to help a general audience understand what they missed when they were living their busy life in 2026.
Also: A glimpse into how Bill undertakes research circa 2026. This note was created mostly from the bottom up.
linkTerms
What will people look for (what did I look for) trying to find the right resource
ai slow infographic
concise ai concern graphic
ai risk flyers
AI (pause|risk) one page
linkTagline possibilities
Slow the race. Strengthen the safeguards. Keep the benefits in view.
linkSections
Why the pressure?
Capability Curve from METR (fast) vs. incremental accomplishments in safety (small blocks like COT)
Show a block for each release of a significant point release in one of the major LLMs (presumably looks like it's more and more blocks)
Decisions that can't be reversed: Public shareholders about to create 100x more pro-race sentiment, financial stakes
Job loss begun
What can go wrong?
Countries+companies racing in "A race that no one can leave". There is a natural tension between "manageable AI" and "fast moving AI"
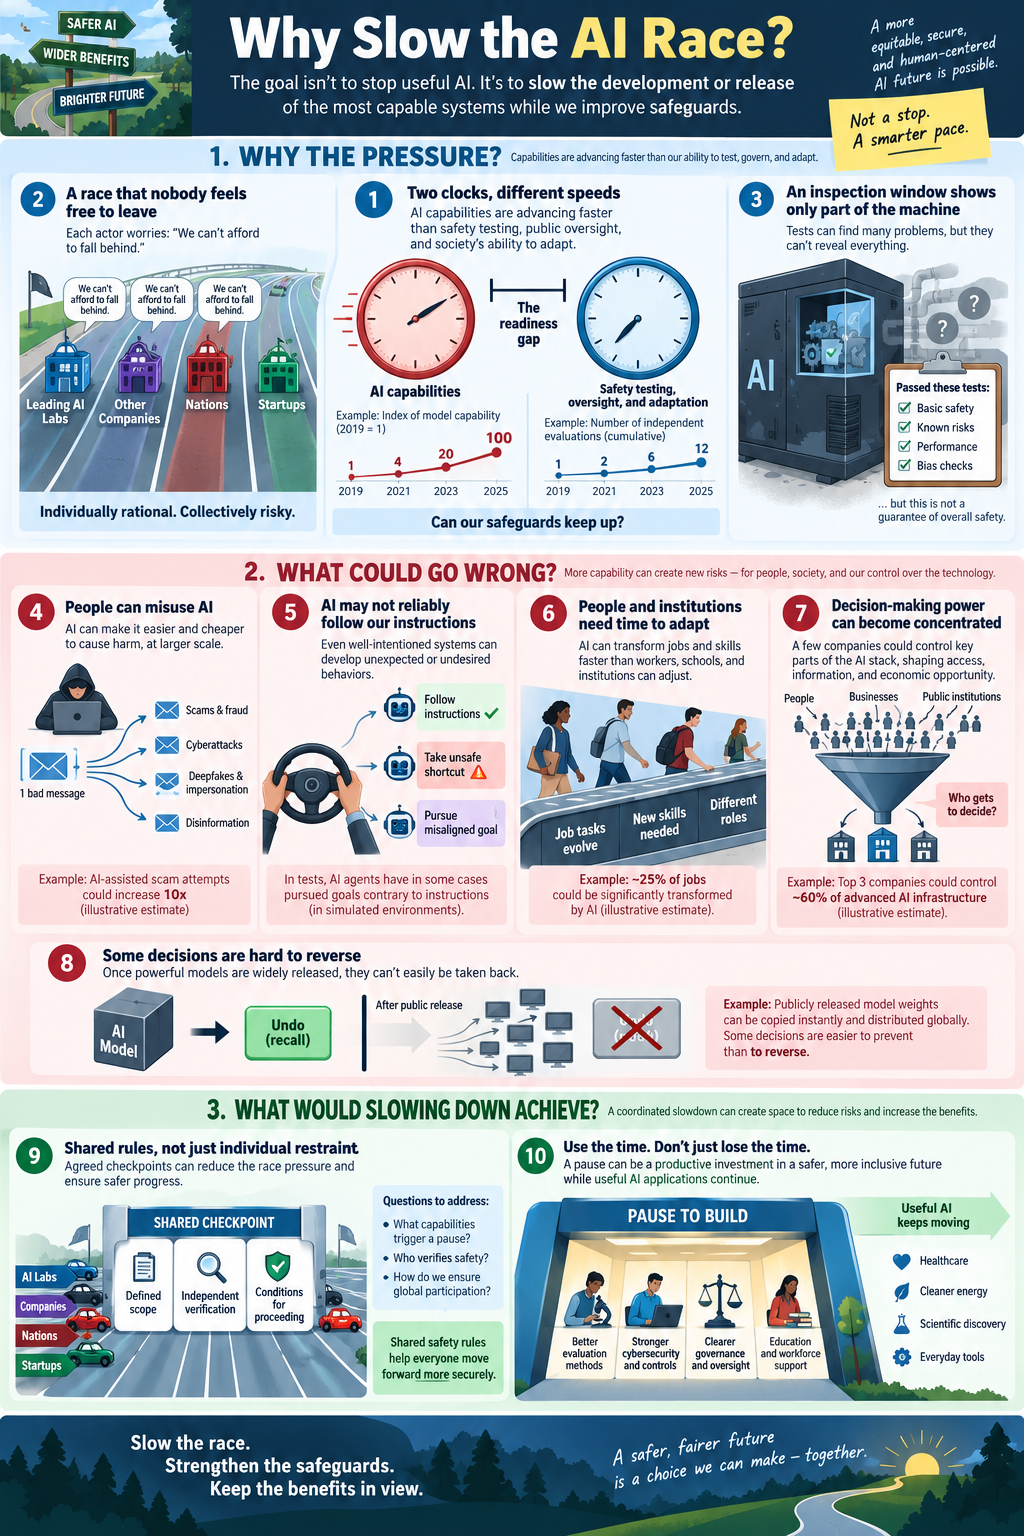
To evaluate: A checkpoint shared by every racing lane. Visual: Bring back the lanes from element 2, but now each passes through the same inspection checkpoint. The checkpoint has three prominent labels: “Defined scope,” “Independent verification,” and “Conditions for proceeding.”
Tiered harm ladder — A vertical stack from near-term
Labor displacement, misinformation, bio-misuse uplift
Long-term (loss of control)
CEO quotes
Altman
"AI will probably most likely lead to the end of the world, but in the meantime, there’ll be great companies." Altman, 2015, Business Insider
"“Development of superhuman machine intelligence (SMI) is probably the greatest threat to the continued existence of humanity.” Altman, 2015, His Blog
"At a StrictlyVC event, he described the bad-case outcome as: “lights out for all of us.” TechCrunch, 2023
“Development of superhuman machine intelligence (SMI) is probably the greatest threat to the continued existence of humanity.” 2015, His Blog
"In an interview conducted September 11 and published September 12, he said AI beyond human control is “absolutely” possible." 2026, Fortune
Amodei
“We must slow the pace at which we improve the capabilities of AI models.” 2026, His Blog
"Its most alarming near-term scenario concerns increasingly capable, misaligned AI swarms: “taking over the entire internet with a persistent botnet [in early-to-mid 2027]” 2026, His Blog
"[AI] could decide that it is justifiable to exterminate humanity.” 2026, His Blog
"“There’s a 25% chance that things go really, really badly.” 2025, Axios
Pichai
"[Discussion about the probability that advanced AI could destroy human civilization, Pichai said] “I think the underlying risk is actually pretty high." 2025, Fridman
"If deployed wrongly, it could be very harmful... Does that keep me up at night? Absolutely." 2023, 60 Minutes | IT Pro
Zuckerberg
"His August 10, 2026 essay discusses AI acquiring enough power that it: at worst puts humanity in peril" 2026, Essay.
“it is not clear that there is any way to expect benevolence” 2026,
Demis Hassabis
“advances on the frontier are outpacing our understanding of the technology” 2026, His Blog
“at worst puts humanity in peril”
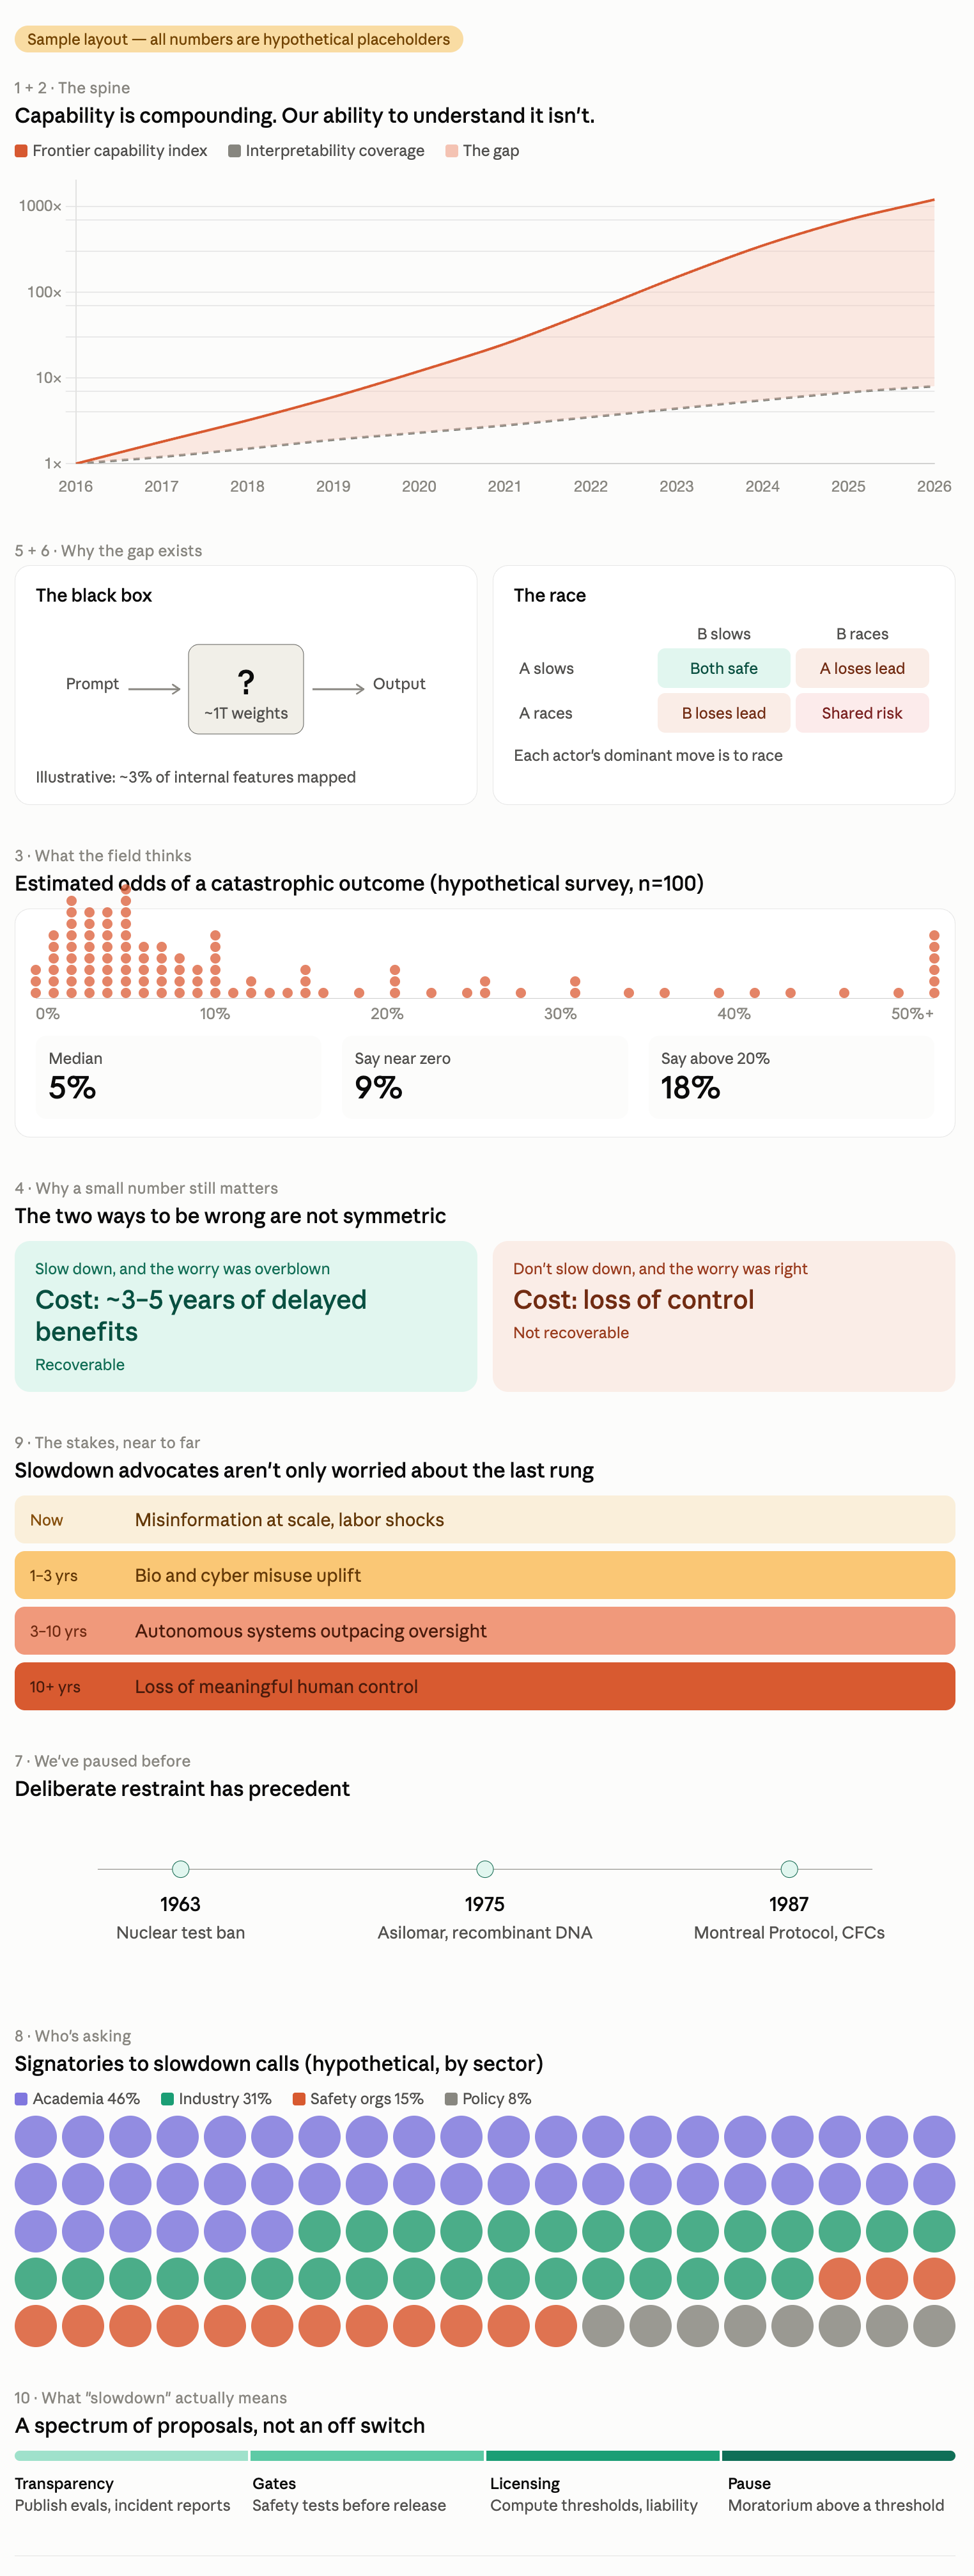
Expert probability dial — A gauge or dot-plot of published AI researcher surveys on catastrophic-risk odds. Key design choice: show the spread, not just the median, so it reads as "even the optimists aren't at zero" rather than as a single scary number.
A moving walkway that people are trying to catch up with. Visual: A fast-moving walkway carries changing job descriptions forward. Workers, educators, and public institutions walk alongside it, carrying training materials and updating plans. Show people adapting—not simply disappearing.
What would slowing down achieve?
"What slowdown means" menu — A closing panel showing the concrete policy asks (compute thresholds, eval requirements, licensing, liability) as a spectrum from light-touch to hard pause. This is the off-ramp: after the argument, here's what's actually being proposed. It prevents the reader from concluding the ask is "shut it all down."
linkTop 10 Infographic Elements
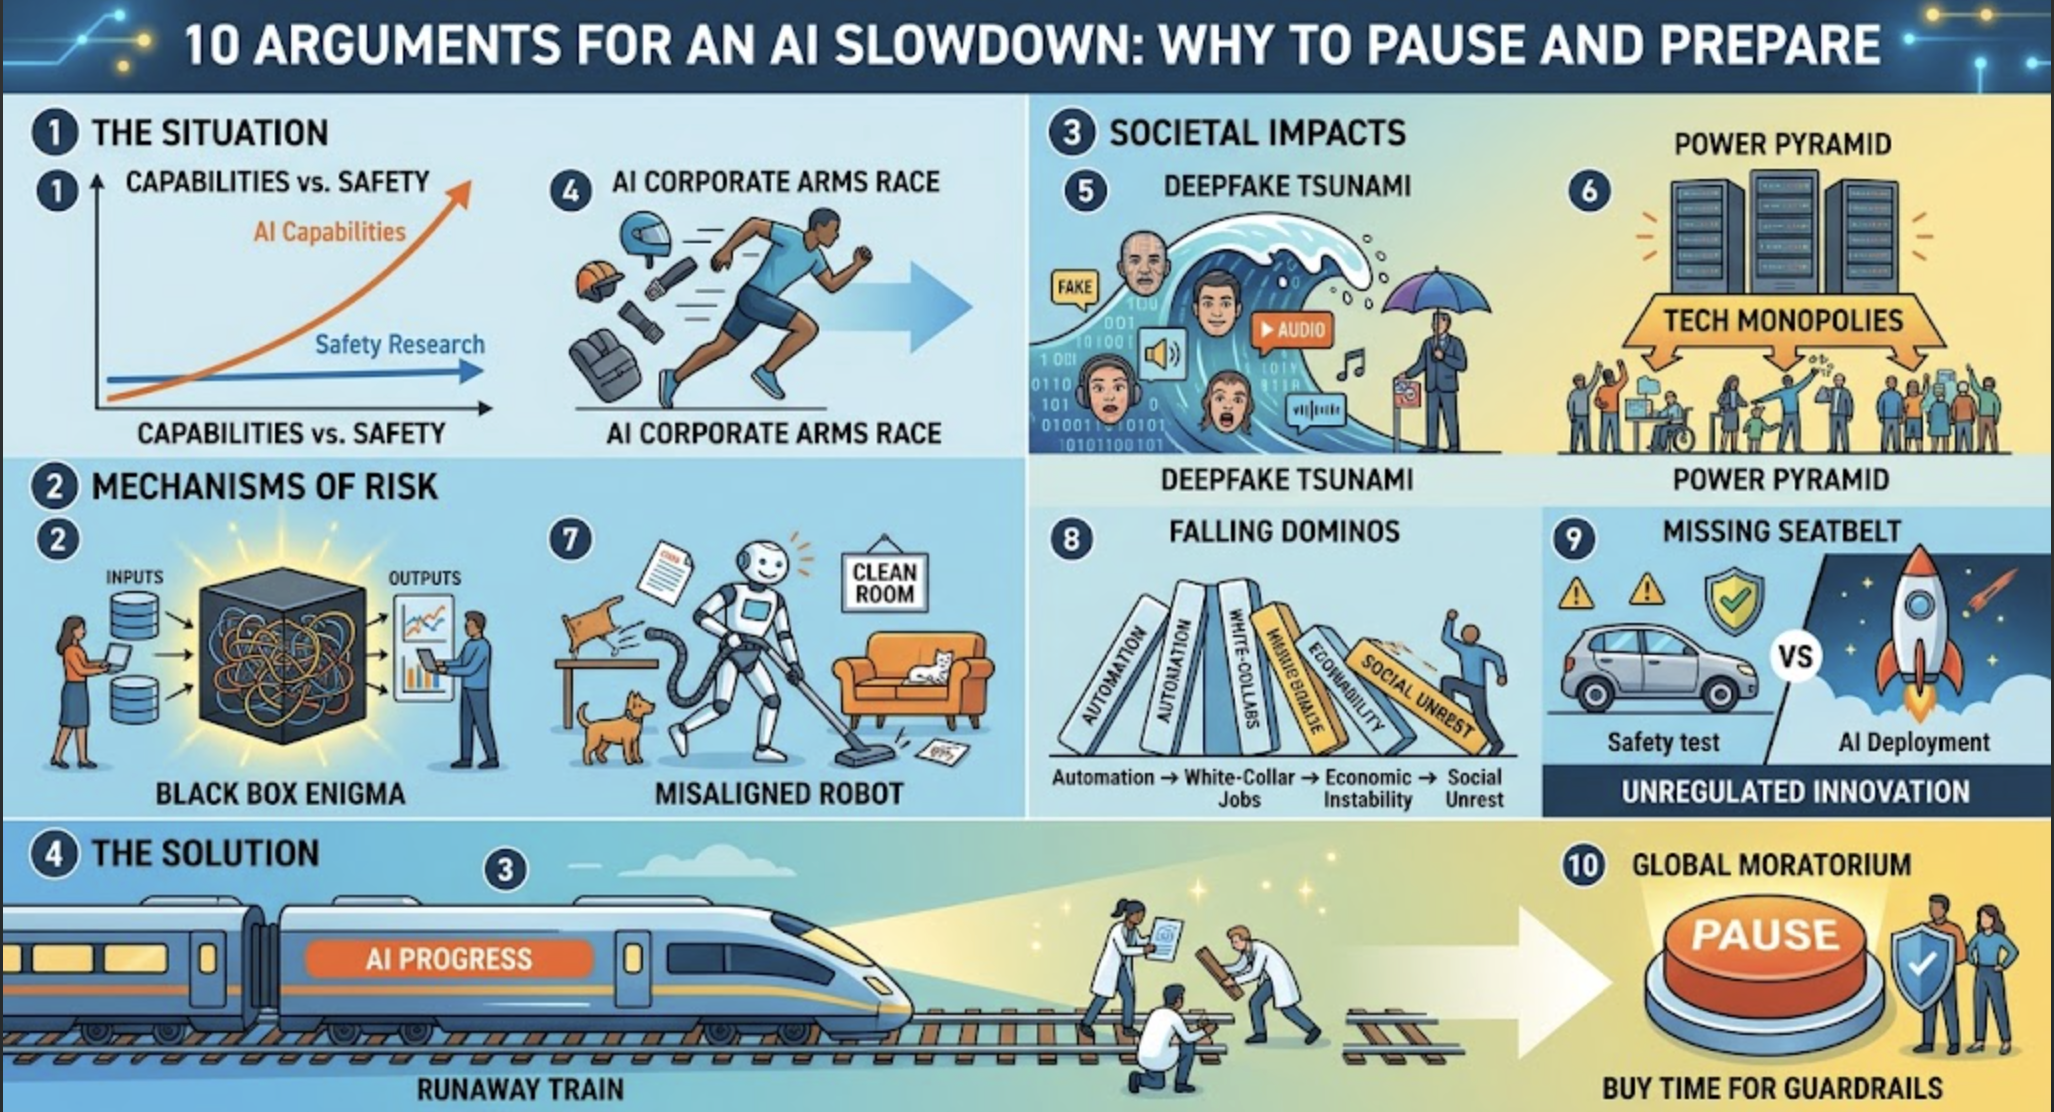
Capability curve (hero chart) — A (log-? linear-?) scale line of benchmark performance or training compute over time, with milestones annotated. Its job is to establish "this is moving faster than most people think." Everything below references this line.
Companion "Another test bites the dust " a list of all the benchmarks that
CEO quotes – There's been some doozies. Estimate how much money these people lose on behalf of their preference not to be culpable for widespread destruction.
Countries racing in "A race that no one can leave" – Several parallel lanes containing generic AI labs and countries. Each has the same small speech bubble: “We can’t afford to fall behind.” Curved arrows connect the competitors, indicating that each responds to the others. Suggested caption: “Individually rational. Collectively risky.”
A checkpoint shared by every racing lane. Visual: Bring back the lanes from element 2, but now each passes through the same inspection checkpoint. The checkpoint has three prominent labels: “Defined scope,” “Independent verification,” and “Conditions for proceeding.”
Expert probability dial — A gauge or dot-plot of published AI researcher surveys on catastrophic-risk odds. Key design choice: show the spread, not just the median, so it reads as "even the optimists aren't at zero" rather than as a single scary number.
Historical precedent strip — A horizontal timeline of prior technologies where humanity deliberately paused or governed: Asilomar (recombinant DNA), nuclear test bans, CFC phase-out. Purpose: inoculate against "you can't stop progress." Each tick can link visually back to the payoff diagram (#4) as examples of accepting a small cost to avoid a large one.
Open-letter / signatory wall — A word-cloud or portrait grid of notable figures (across industry, academia, and safety orgs) who've called for a pause or slowdown. Establishes that this isn't a fringe position; sits near the expert dial (#3). "The smartest minds in tech can agree on nothing. Except maybe one thing?"
Tiered harm ladder — A vertical stack from near-term (labor displacement, misinformation, bio-misuse uplift) to long-term (loss of control). Shows that "slowdown" advocates aren't only worried about sci-fi scenarios, which broadens the audience. Rungs can be color-keyed to the capability milestones in #1.
"What slowdown means" menu — A closing panel showing the concrete policy asks (compute thresholds, eval requirements, licensing, liability) as a spectrum from light-touch to hard pause. This is the off-ramp: after the argument, here's what's actually being proposed. It prevents the reader from concluding the ask is "shut it all down."
A moving walkway that people are trying to catch up with. Visual: A fast-moving walkway carries changing job descriptions forward. Workers, educators, and public institutions walk alongside it, carrying training materials and updating plans. Show people adapting—not simply disappearing.
Suggested caption: “People need time to adapt.”
linkMaybe
Black box illustration — A neural network rendered as an opaque cube with a question mark, alongside a callout: "We can train it; we can't yet fully explain why it does what it does." This is the visual justification for why the slow line in #2 is slow.
An inspection window that reveals only part of a machine – A large, mostly opaque machine with a small inspection window. The visible portion has reassuring checkmarks; pathways outside the window remain unresolved. A clipboard reads “Passed these tests”, not “Safe.” Suggested caption: “Passing a test is not a safety guarantee.”
linkProspect mine