The skills page offers more specific stats for each individual compared to other contributors in your entity, organization, or repository.
linkSkills Comparison
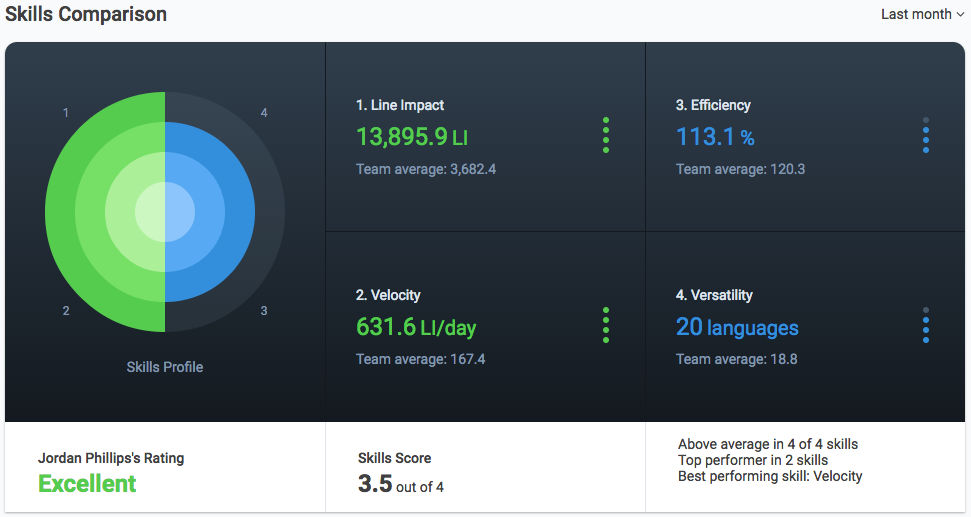
The Skills Comparison chart measures 4 metrics for the individual against the team average. The individual is given a rating and score based on their performance.
Line Impact (LI) - A relative measure of commit value based on the changes made to the code. For more read: What is Line Impact and how does it work?
Velocity - LI per day
Efficiency - Average LI per commit.
Versatility - Number of different file types/languages used by the contributor during this period.
linkCohort Comparison
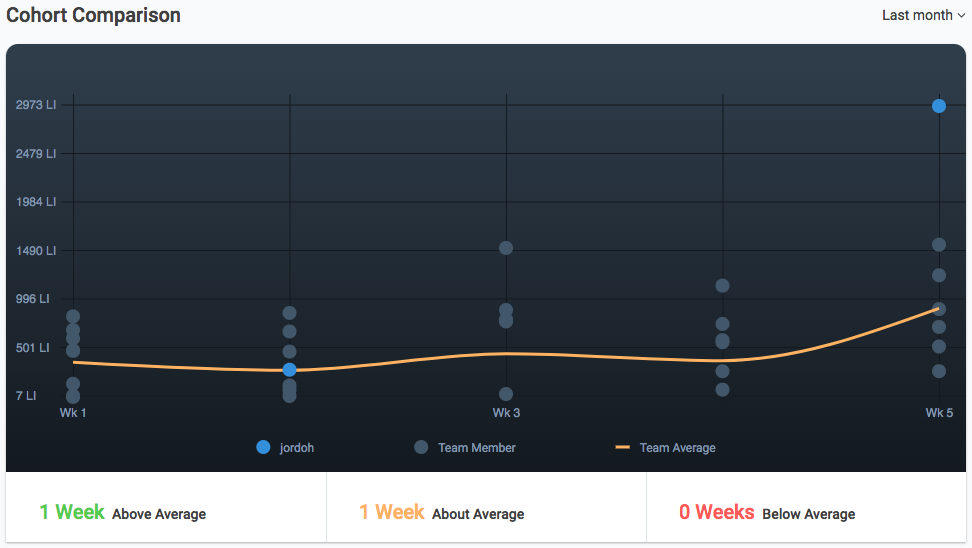
The Cohort Comparison gives a week by week comparison of where this contributor falls compared to team members based on the LI for that week.
linkDeveloper Comparison by Week

link
On this chart, you’ll learn how developers of all experience levels compare to one another over your selected time range.