One of the most common goals among proactive Lead Developers and Project Managers who adopt GitClear is to determine which developers are struggling, and what they can do to help. GitClear offers a few different options to answer these important questions.
linkWho's struggling this week?
If you want to get a quick sense for who might be blocked on their current project the Commit Activity Browser: Illustrated Usage Guide is your go-to resource. When you visit your own Commit Activity Browser (under the "Code" tab), you'll see something like this:
Commit Activity Browser being used to identify potentially struggling developers 10 developer team
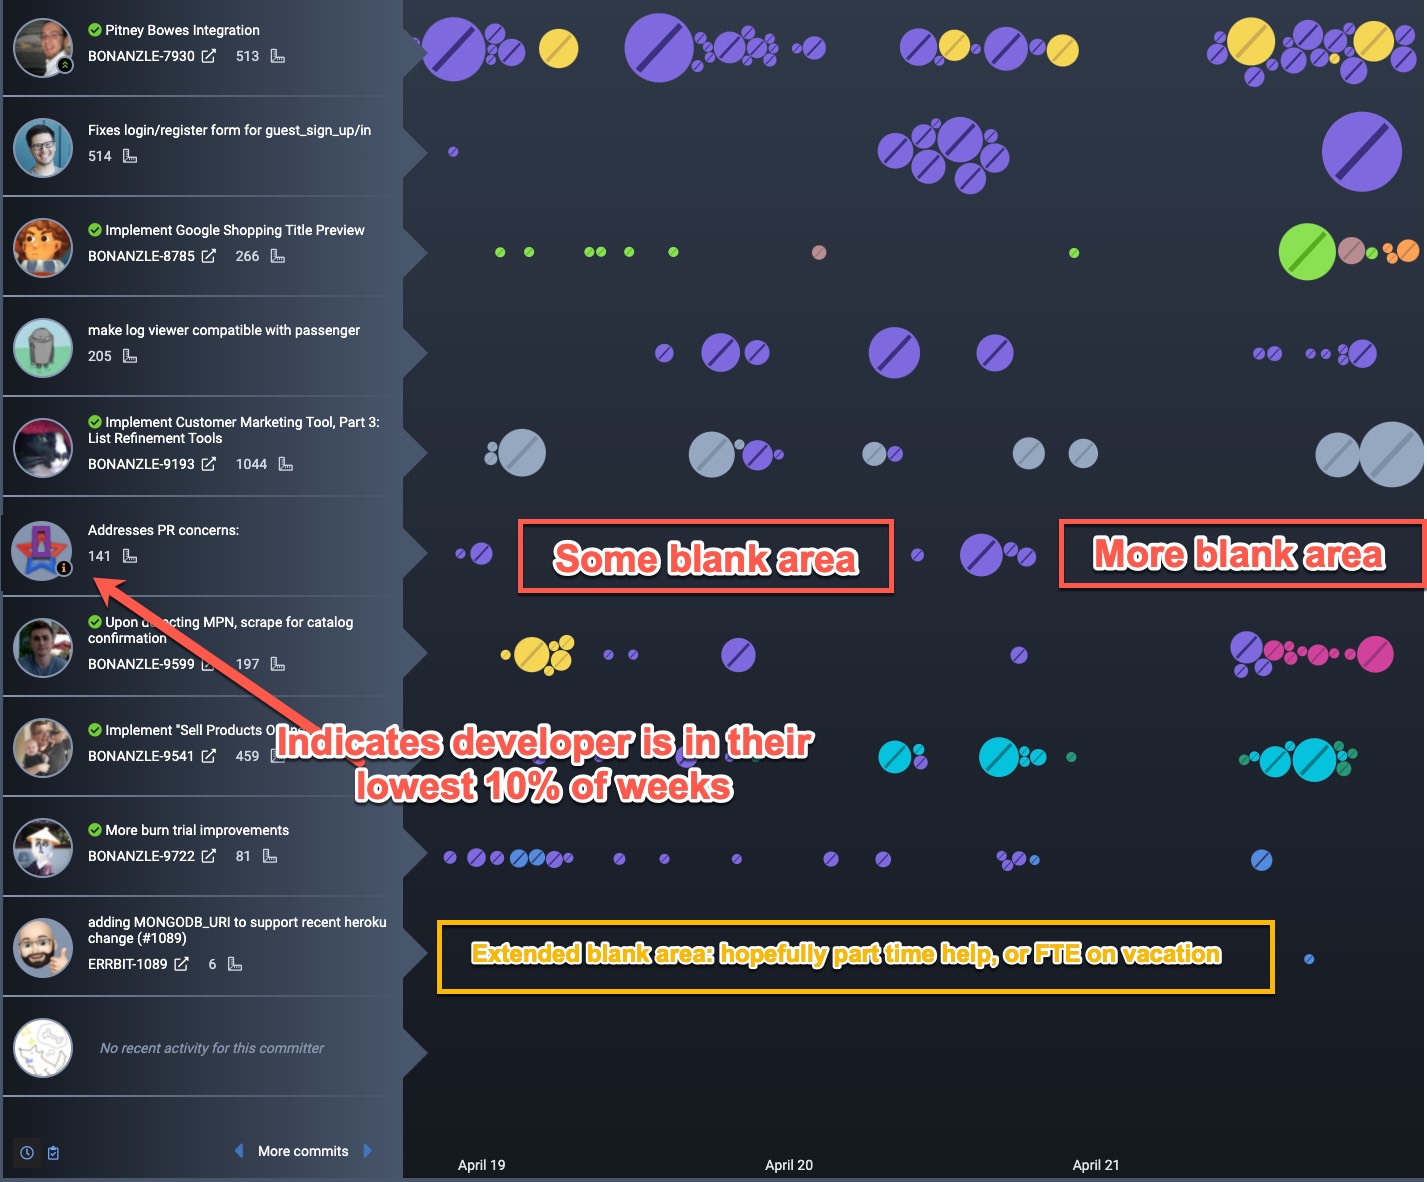
On the bottom row of the screenshot, we can see that the developer activity spans three days. Most teams encourage developers to make at least one commit per day, so when you see a developer that has long stretches of empty space between their circles, those are the windows of time where the developer has failed push any newly authored work to their git provider. If you don't have an explanation for why the developer would idle, then that's a great time to have a discussion.
Another way to tell when a developer might be struggling is when they have the yellow "i" icon attached to their avatar. This indicator is added to a developer's avatar when their current week is in the lowest 10 percent of Diff Delta scores from the past year. If you hover on the avatar, you'll get a list of all their weekly Diff Delta values from the past year, and where the current week ranks among those (if they have the yellow icon, that implies this week's Diff Delta is on the very bottom end).
linkWho's struggling at a particular time across many weeks?
Sometimes a manager senses that there are certain times of week that a developer seems is absent or difficult to connect with. To get a sense for how the developer's coding output varies by hour of the week, check out the Hourly Diff Delta graph. Here's an example of what you might find:
A developer with an unusual hourly commit pattern

In this case, the developer seems to be spending as much time working on Sunday as during a weekday. If this is a standard salaried employee, this could be a red flag that the employee is likely to experience burnout.
Additionally, their productivity on Wednesday is noticeably lighter than the rest of the week. Are there extra meetings on Wednesday that might be interfering with the developer's flow state? Or is the developer working on unmeasured projects on Wednesday? If you were to find a graph like this, it would merit a handful of follow up questions.
linkWho's struggling across weeks, months, or years?
The Historical Diff Delta graph can show you how a developer's output has changed over weeks, months, or years. For example, here's the graph for GitClear Programmer/CEO Bill Harding over the past five years:
Developer's past three years of activity suggest that the years between 2016-2018 were a struggle
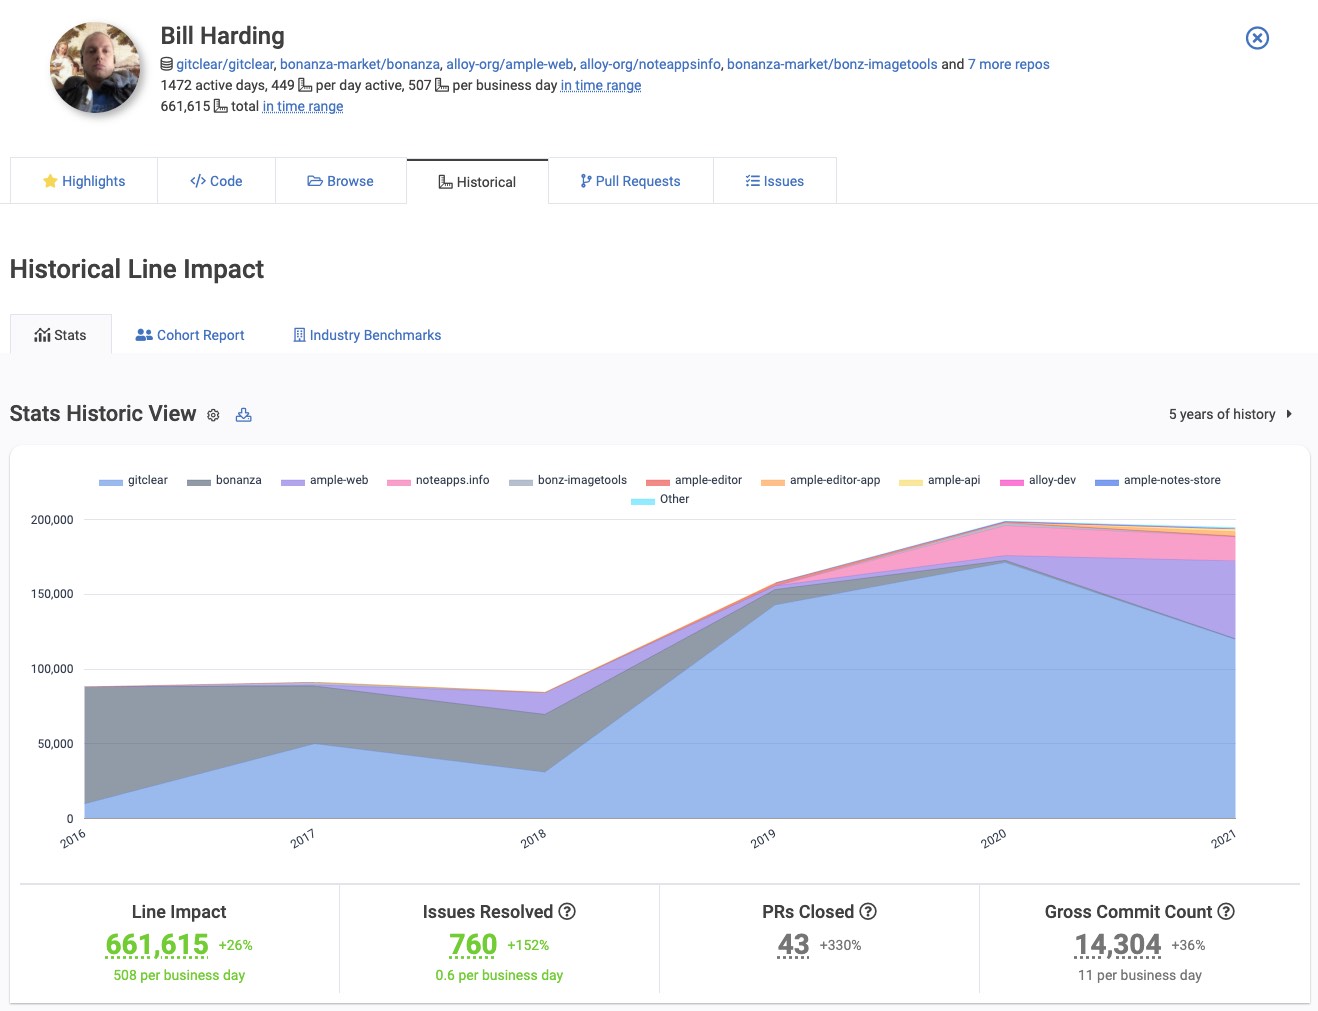
Every developer has their own baseline, and it's not uncommon to have some developers that average 50 Diff Delta per day and others that average 300-400 Diff Delta per day. When it comes to helping developers, you want to focus on how the individual developer has varied from their historic norms.
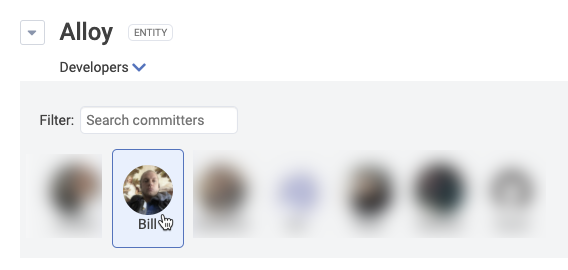
This is possible by filtering on individual developers from the "Developers" dropdown beneath the Entity's title:
Choosing an individual developer to view their stats over time
Let's look at another developer, from the Facebook React repo:
A part time project developer

It seems apparent that this developer is only working part time on the React project, about once per quarter. As a manager, it would be great to have a conversation with the developer about what other projects they are currently tasked with, and whether those secondary projects could be removed from the schedule.
linkWho's struggling after being hired?
GitClear provides a special graph for easily visualizing how a newly hired developer is ramping up compared to past hires. The Cohort Report helps you compare apples-to-apples by comparing all past developers based on the weeks since their first commit.
A part-time developer is easily identified using the Cohort Comparison Report

In this screenshot, a new developer for the repo being viewed is only working on the project part-time, and the stats recognize that a developer working fractional hours has fractional return on their output ("20th relative to past developers 2nd week"). If this developer were expected to be working full time, it would be a red flag that every week they have scored lower than every past developer at a corresponding time during their tenure.
The Cohort Report can be found under the Historical -> Cohort Report tab. It is available to Elite subscribers.