Industry Benchmark Lines are a Pro+ feature. The "Median" line is unlocked by a Pro subscription, and the "standard deviation" lines are unlocked by an Elite subscription. Learn more about GitClear subscriptions here.
One of the most common questions asked by GitClear customers is along the lines of: "What do these numbers actually mean?" This question typically comes in the context of a graph that seems to be moving relative to its previous baseline.
When it comes to comparing the team's Diff Delta on a particular chart, one option is to use the Industry Stats to see how the per-developer change velocity of big companies (e.g., Microsoft, Google, Facebook) compares to the per-developer change velocity of your own team. But since the dedicated Industry Stats only reveal average Diff Delta, it is insufficient to illustrate how your team compares to others on dimensions like "code quality." That's where industry stat comparisons on charts comes to the rescue:
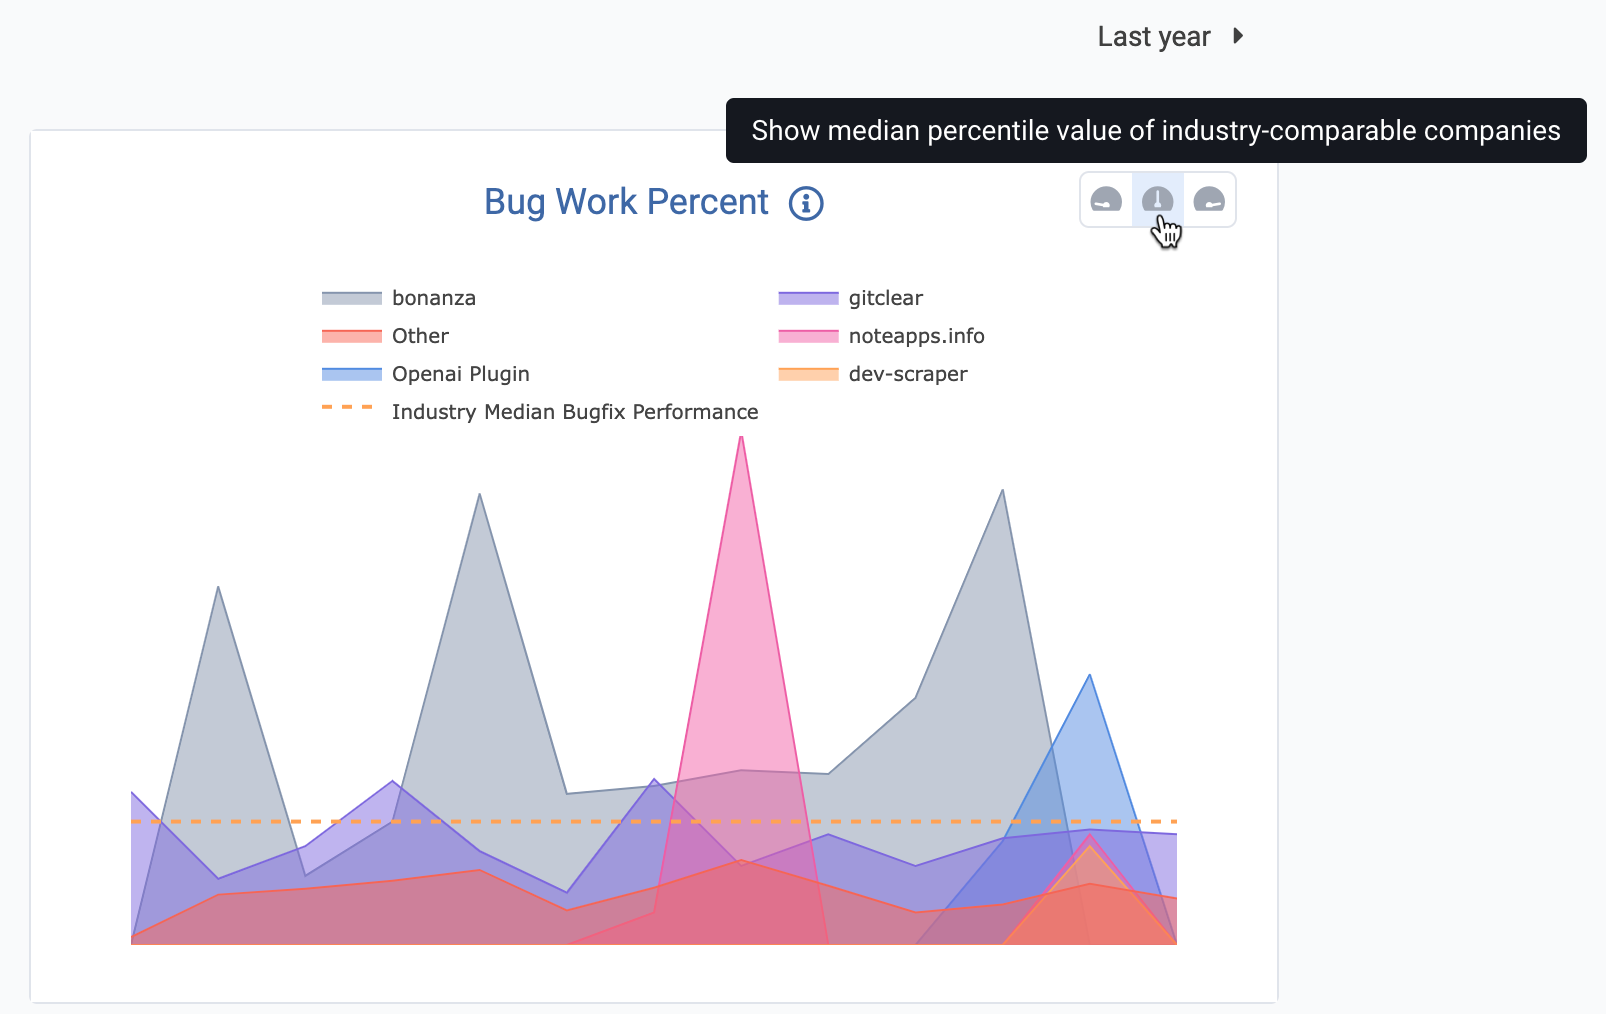
When hovering on a graph that allows industry stat comparisons, you'll see icons to enable the "low," "median" or "high" value for comparable companies
Once you choose an industry stat benchmark level to show, that benchmark will be enabled across all subsequently loaded graphs.
If enough users vote for it on our feature voting boards, we may change setting to be per-graph, but we believe it is generally advisable to consider at least the median for any graph.
linkHow are industry stat estimates derived?
Various calculation methods are required, depending on the quantity being derived. Because we believe customers benefit from understanding how their data is derived, we will discuss the general method by which these stats were derived, as well as a few of the particular edge cases that were considered.
linkGeneral method
When an entity has opted in to sharing industry stats, they are eligible to view the Industry Stat Benchmark Lines. The Industry Stats that we record are calculated on a per-week basis, so most of the industry stats that we offer are also calculated by examining a large (e.g., 5,000+) sample of weekly values. By examining thousands of randomly sampled weeks, we can examine and report the various percentiles observed when the data sample is sorted.
Not all stats are derived from industry stats. A few, like Delta Velocity, and some pull request stats, are derived from monthly stats, where the weekly values have too great a degree of variance to be stable.
The "Median" line reports the value at the midpoint of our large weekly or monthly sample. The exact percentile of "Low Performance" line is subject to change, but you can think of it as roughly one standard deviation below the median (around the 30th percentile). The "High Performance" line is about one standard deviation above (around the 70th percentile).
Since these numbers are the result of large-scale sampling, and since the quantities being measured can evolve over time (especially as AI-generated code becomes more prominent), they will inevitably vary from week-to-week. However, we have empirically observed the variance tends to be less than 10%.
linkSpecific calculations
If you hover over the title of the graphs with Industry Benchmark Lines, a tooltip will generally pop up to offer a few paragraphs of explanation about how the data was derived. If there are any charts whose explanation feels inadequate to you, feel free to drop us a line at support and we'll endeavor to improve it. If you include the proposed language you'd use for a change, that will increase the odds we use your suggestion. 🙏
The method by which we determine what constitutes a "meaningful line," (the denominator in "moved lines" and "copy/paste lines") is described in depth on the aptly named "What Constitutes a Meaningful Changed Line?" help page.