Most large engineering organizations now spend more on LLM tokens than on their entire observability stack. Almost none of them can say what that spend bought. This article explains how GitClear plugs into the Delta Lake / Databricks tables an Enterprise already maintains and enriches them with the one thing they lack: the long-term outcome of every AI-assisted change.
If you work in an Enterprise and would like a free quote on data enrichment, contact sales hello@gitclear.com
link1. The problem: millions in LLM spend seeks an efficacy correlate
An Enterprise with 2,000 developers on Claude Code, Cursor, Copilot or an internal gateway routinely clears seven figures per year in inference costs, and the distribution is wildly uneven. It is no longer unusual to find a single Senior developer consuming thousands of dollars of tokens per day. Is that person an anti-pattern to be reined in, or the prototype every other team should be copying?
Today nobody can answer that, because the two halves of the evidence live in different systems. Finance sees the invoice. The git provider sees the pull requests. Neither sees the link between them: which tokens produced which lines, whether those lines survived code review, and whether they were still in the repository three months later or quietly rewritten. Dashboards from AI vendors report "acceptance rate" and "lines suggested," metrics that measure enthusiasm rather than durable output. Executives are left approving renewals on anecdote.
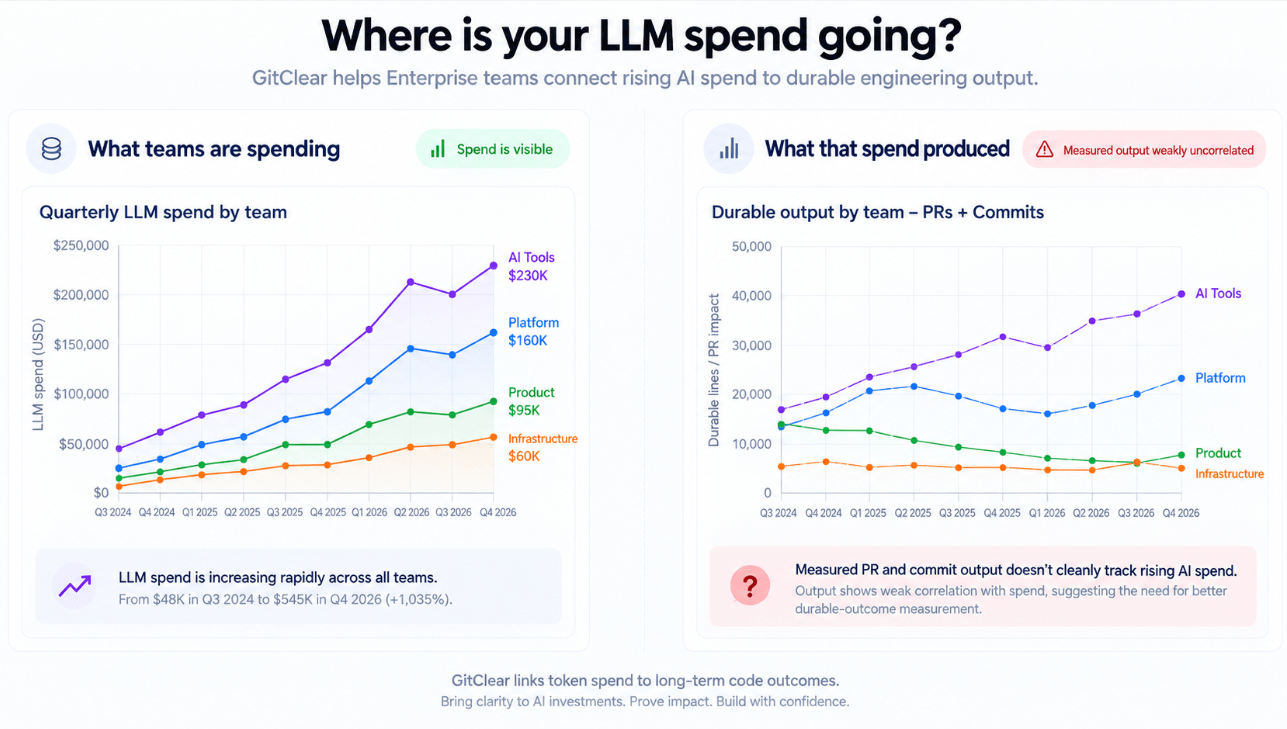
Typical Enterprise company in 2026 lacks confidence in the efficacy of its LLM spend
link2. The opportunity: the data is already being captured
Data-driven Enterprises rarely let LLM traffic leave the network unobserved. Usually at the direction of Legal, Security or a Works Council, requests and responses are routed through a gateway that logs every call so the company can later substantiate (or refute) what was sent to a model from inside its perimeter. Common choices include:
AI gateways and proxies: Portkey, LiteLLM, Kong AI Gateway, Cloudflare AI Gateway, Azure API Management
LLM observability platforms: Helicone, Langfuse, Braintrust, Arize Phoenix, Datadog LLM Observability
Cloud-native invocation logging: Amazon Bedrock model invocation logs, Google Vertex AI request/response logging, Azure OpenAI diagnostic logs
Vendor-side telemetry: the Anthropic Enterprise Analytics API, OpenTelemetry exports from Claude Code, and GitClear's own open-source telemetry hooks for coding agents
Whatever the source, the destination is the same: a Delta Lake table in Databricks (or Snowflake, or BigQuery), holding billions of rows of prompts, completions, model IDs, token counts and timestamps. It was built for compliance. It is, unintentionally, the most complete record of how a company's engineers actually work that has ever existed.
The catch is that a request log by itself only tells you what was asked. It says nothing about what happened next. Joining it to what happened next is the entire opportunity.
link3. GitClear's solution: a watermark processor inside your pipeline
GitClear does not ask an Enterprise to export its data to us. We ship a Docker container that runs inside the customer's own data-processing pipeline, reading from and writing back to the customer's tables.
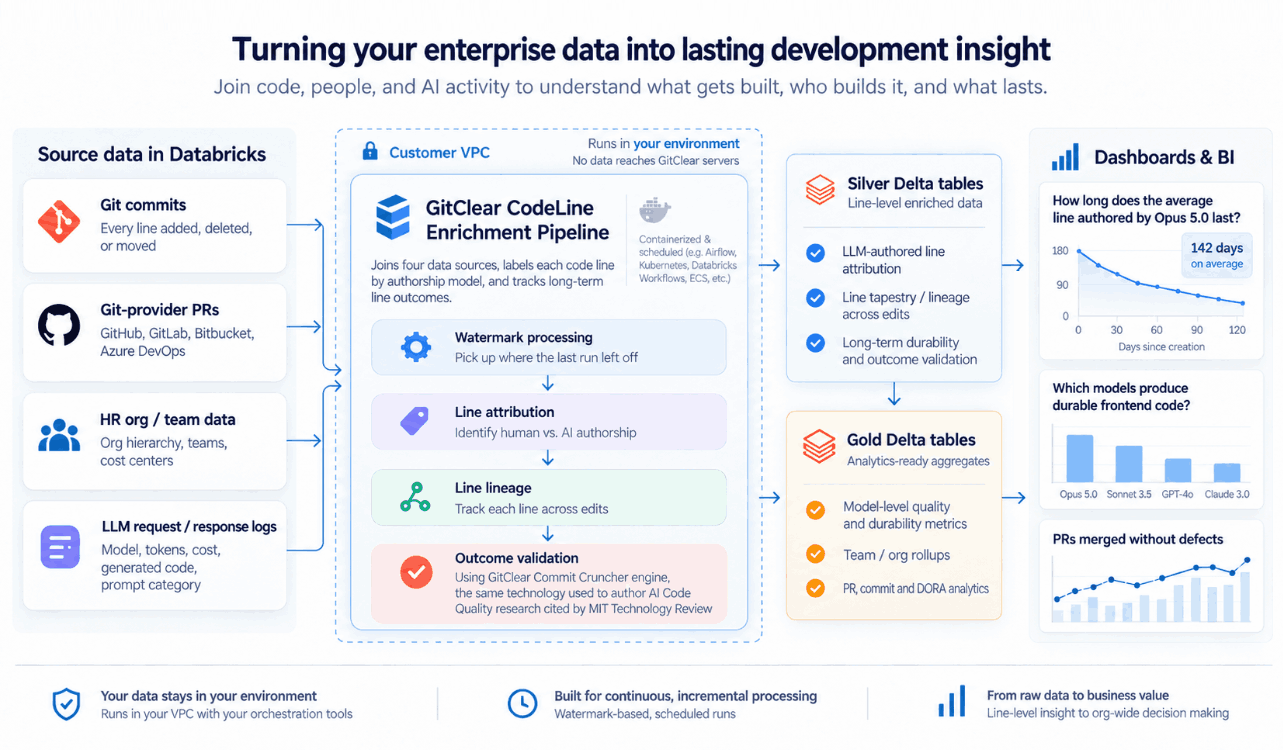
Transforming existing Databricks tables into enriched Silver and Gold tables
It has been deployed as:
an Astronomer (Astro) / Apache Airflow DAG task
a Kubernetes CronJob or Argo Workflows step
a Databricks Workflows job (container task on a jobs cluster)
an AWS ECS / Fargate, Google Cloud Run Jobs or Azure Container Apps scheduled task
a Dagster or Prefect flow, for teams standardized on those orchestrators
The container is built for watermark processing: each run picks up where the last one left off, so a nightly or hourly schedule keeps the enriched tables current without ever reprocessing history. It amalgamates four sources that have never previously been joined at scale:
Source | What it contributes |
Git commits | Every line added, deleted or moved, classified by GitClear's Diff Delta engine into substantive change vs. churn, copy/paste, no-op refactor and whitespace |
Git-provider PRs (GitHub, GitLab, Bitbucket, Azure DevOps) | Review turnaround, approvals, the comments an AI code-review agent left and whether humans acted on them |
HR / org data (Workday, BambooHR, an LDAP export) | Team, department and cost-center membership, so results roll up to the units executives actually manage |
LLM request/response logs | Model, token counts, cost, the code that was generated, and a prompt-category classification (bug fix, new feature, test, refactor, documentation, exploration) |
The output is a set of Delta tables that answer, row by row, the question no single source could: this model, prompted for this kind of task, by this team, generated these lines, which did or did not make it through review and did or did not survive to today.
link4. What's possible? Actionable stats > interesting stats
Every graph GitClear produces from the enriched tables is framed around a decision a Director, VP or Executive has to make. Three examples, currently on the roadmap for our Enterprise engagements.
linkDurable change per team — should we spend more or less, and whose behavior should we model?
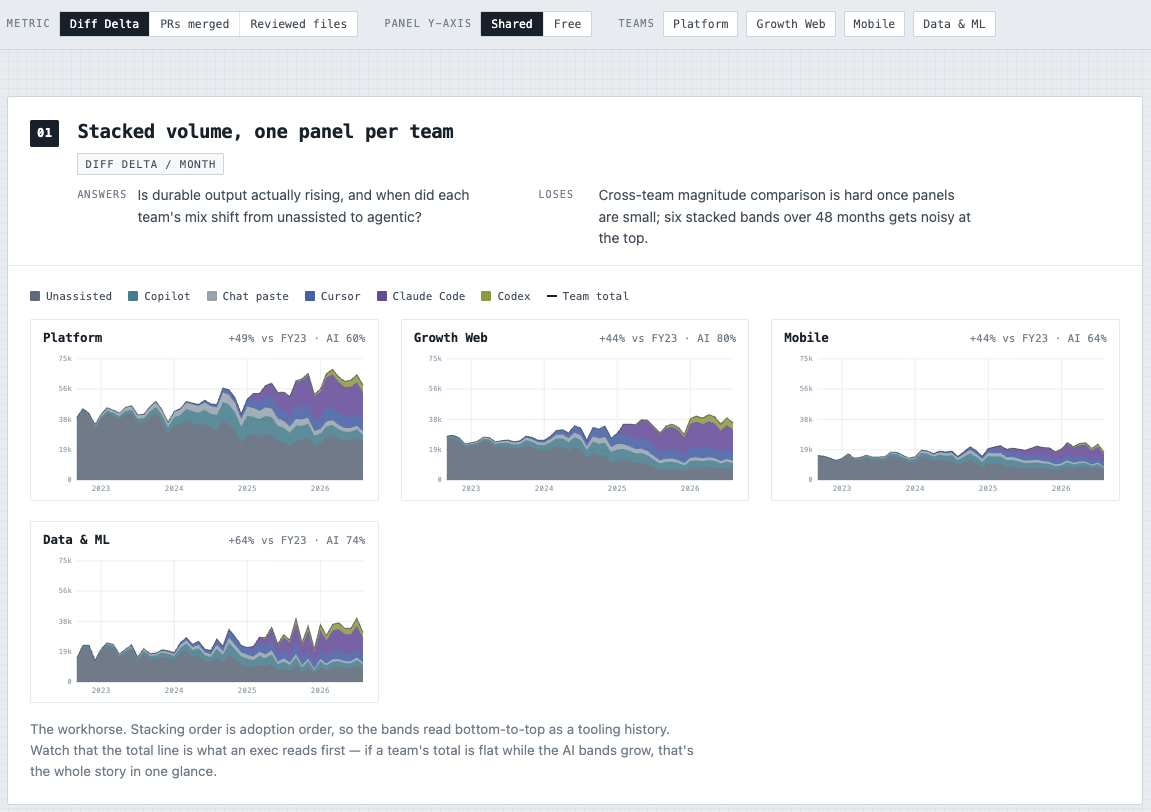
Stacked bars show how much work each model contributed to each team, where "work" is measured three ways: Diff Delta (lines that survived), PRs merged and tickets closed. A team getting 3× the durable output per dollar of a peer team is a blueprint worth studying; a team whose spend is climbing while durable output is flat is a conversation worth having early.
linkTask × model matrix — is the frontier model worth its price?
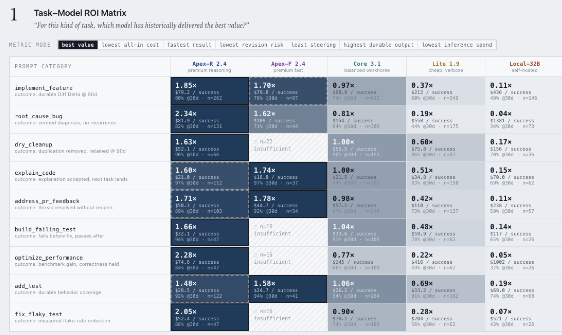
Each cell holds the productivity multiplier observed for a given model on a given prompt category, so the matrix can be sorted by best value, lowest spend or fastest result. It is common to find that a mid-tier model matches the frontier model on test generation and documentation at a fraction of the cost, while the frontier model earns its premium on cross-file refactors. That is a routing policy, and it pays for itself.
linkToken release funnel — how many of our tokens never ship?
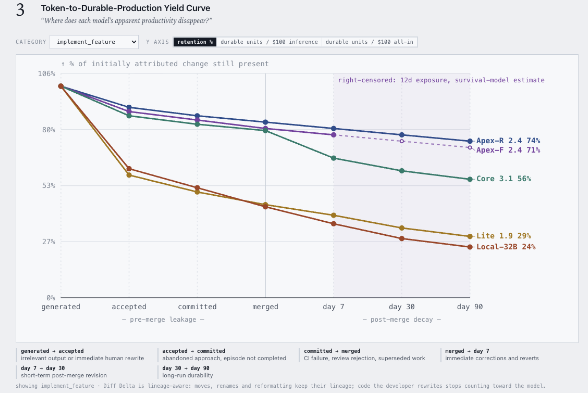
For each model, follow generated lines from "everything the model wrote" through "committed," "passed review," "merged," "released" and finally "still present N months later." The percentage that makes it to the final stage is the truest available measure of a model's output quality. The drop-off between stages tells you where the waste is.
linkFurther cuts available from the same tables
Output per prompt category, independent of who prompted: which kinds of requests yield the most surviving code, and which models require the least user steering to get there.
Code-review agent comparison: what fraction of comments from each AI reviewer were addressed or upvoted by humans, versus dismissed.
Cost per durable line, by team, model or cost center, trended month over month.
linkPrivacy by design
Every result above is aggregated by team, model or cost. GitClear's Enterprise processing skips individual-committer attribution entirely, which keeps the enriched tables clear of PII concerns, GDPR data-minimization questions and Works Council objections that otherwise stall AI-measurement projects in EU subsidiaries. The pipeline also never needs prompt or completion text to leave the customer's environment; classification runs inside the container.
link5. Proven results
GitClear has spent the past decade building the Diff Delta metric and publishing the most widely cited independent research on AI's effect on code quality, drawn from hundreds of millions of lines of code. Over the past year we have integrated that engine into the data pipelines of billion-dollar companies, working as a hybrid internal/external consultant: our engineers sit alongside the customer's data platform team to stand up the container, validate the joins against ground truth, and iterate on the graphs until they answer the questions leadership is actually asking.
The result is data that Directors, VPs and Executives now rely on to contextualize how millions in AI outlay are being deployed: which teams to hold up as examples, which models to route which work to, and where spend is quietly producing code that does not last.
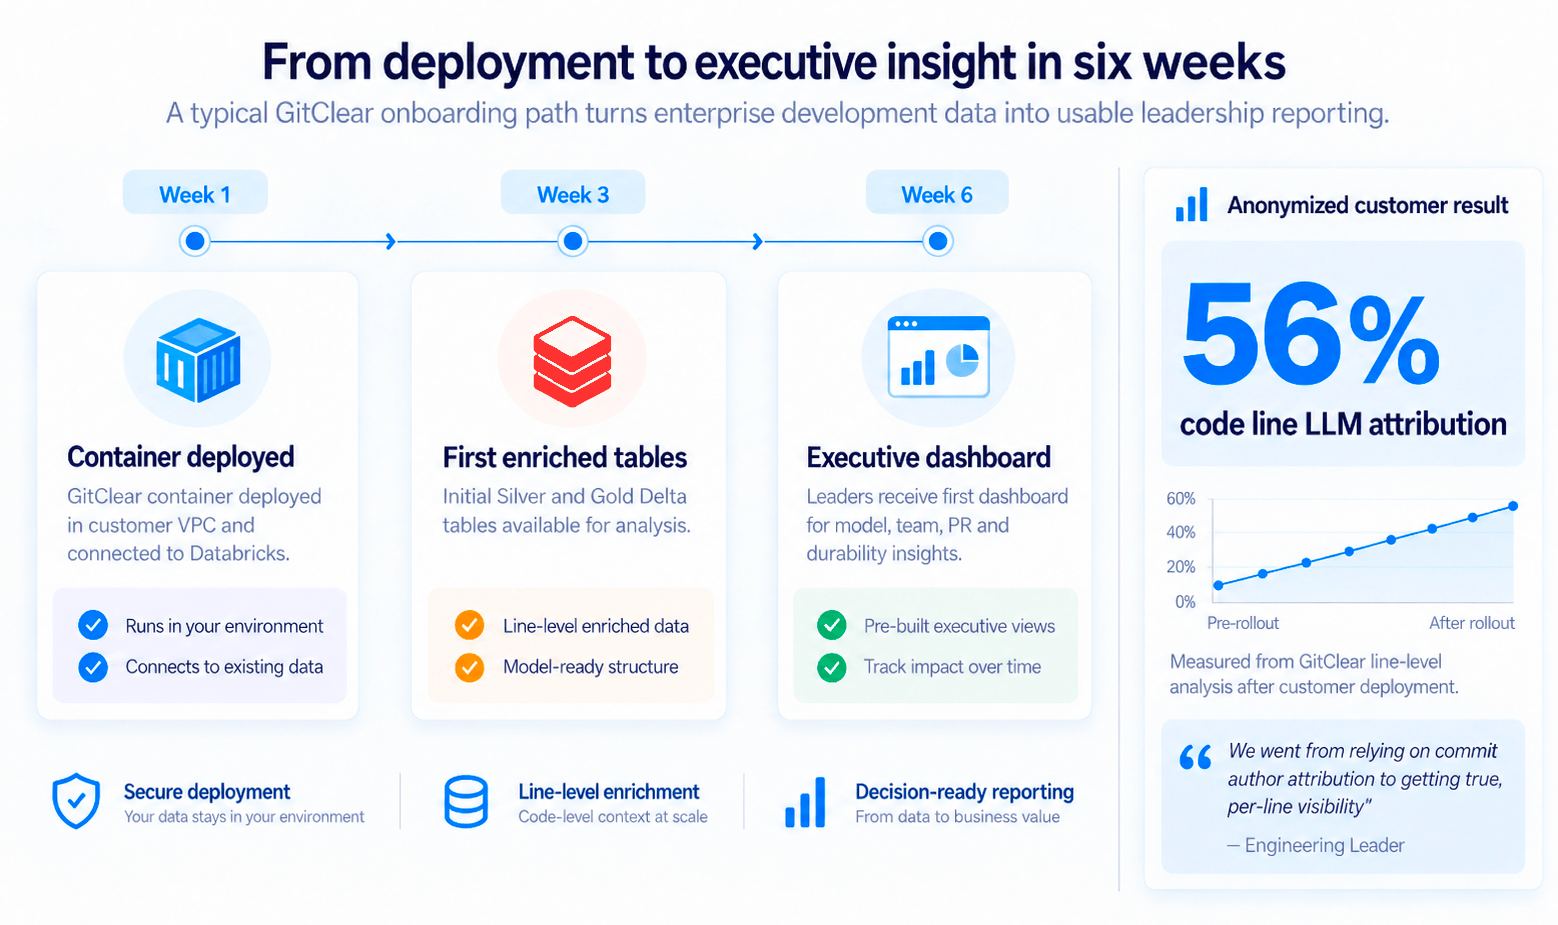
To execute a true 6 week deployment requires our client to have the means to expedite access grant approval. Depending on corporate setup, this tends to consume 4-8 weeks unto itself
If your organization already captures LLM traffic and would like to know what it has been paying for, contact hello@gitclear.com to scope an Enterprise pipeline engagement.