For executives and managers who are too busy to plod through the ~50 different AI ROI graphs offered by GitClear, we offer the AI Scorecard. It comprises three parts.
linkSection 1 – Tool Adoption
The first section breaks down which AI providers the team has been most engaged with during the time period selected.
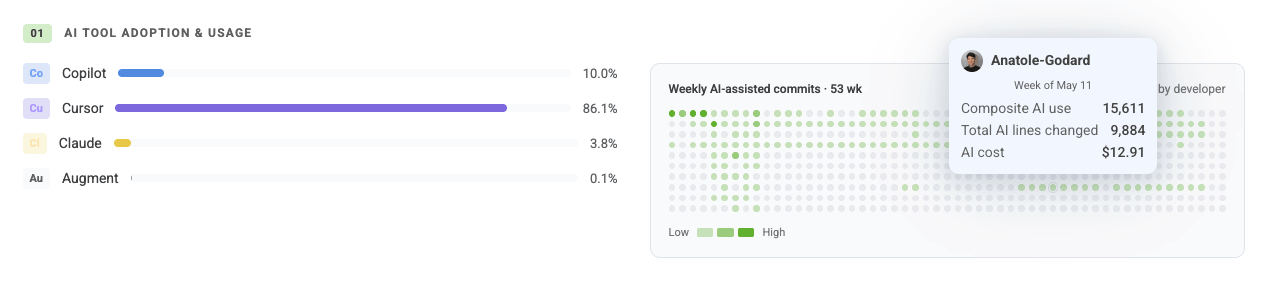
The left side aggregates all of the AI usage that has been cataloged from the sum of the APIs you connected to, plus the telemetry you have connected. The right side counts all of the developer-weeks during the time period in question, and colors the dots on the basis of the relative AI use for one developer on one week. A grid of intense green is a team that is fully engaged with using AI every single week. A graph with more light dots or gray dots is a team whose AI engagement fluctuates depending on task & engagement.
linkSection 2 – Model Usage Durability
One of the constant questions to leaders who want to deploy their AI spend to maximum effect: how much of the code that these models write is going to make it to the deployed final product, vs get churned somewhere on the way to deployment. This view gives you a team- or company-specific look into the quality of the different AI models your team is using.
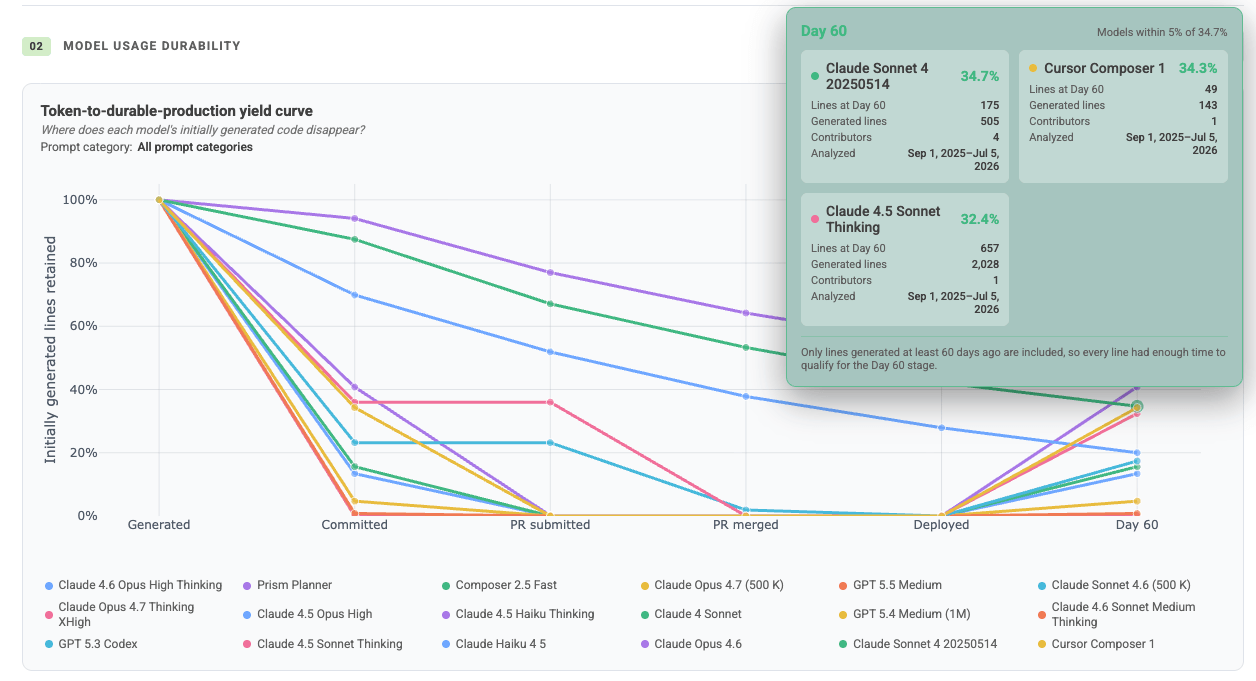
A glimpse into what percent of each models' authored lines makes it through pull request and persists through to day 60
(it's possible for "Day 60" to be higher than "Deployed" if you have repos that aren't set up to instrument when a deploy occurs)
When you see models that quickly plunge from "being generated" to "being in a submitted pull request," that is signal that the models are writing code that tends not to survive the scrutiny of a experienced developers.
On the other hand, when you see models with a high durability, that suggests that you might be able to lighten the pull request review expectations, if there are certain models with especially high persistence at Day 60.
Note that, if you have installed the AI Telemetry packages, you can facet this data by which type of prompt was used. GitClear recognizes about 20 different categories of LLM prompt, and you can see how the "model usage durability" varies for one type of prompt vs. another. For example, you might find that most LLMs have a much higher percentage of code retained when they are working on "greenfield feature implementation" vs "library upgrades."
linkSection 3 – Tiers of AI Usage ("AI Cohort Mix")
Zooming out, how many weeks during the currently-selected time range witnessed the team's developers being vigorously engaged with AI tooling? The AI Cohort Mix has answers:
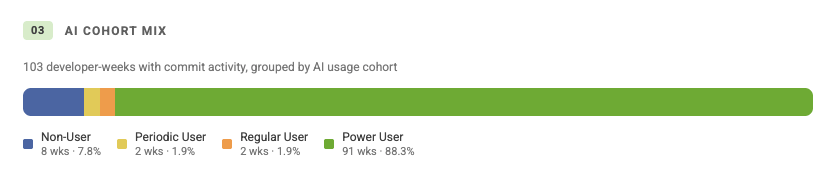
The AI Cohort offers a sense of how engaged the active developers were with their AI tooling
linkSection 4 – Aggregate ROI Signal
This one communicates a high-level sense for how AI fits into the end product being delivered.

In order to produce the "Weekly Time Saved," you'll need to use GitClear's free Developer Sentiment Surveys.