When Elon Musk, Mark Zuckerberg, or Patrick Collison offer an opinion, leaders take note. When all three offer the same opinion, leaders take inspiration. That's part of the reason why "thinking from first principles" is having such a moment in the 2020s.
"I think it's important to reason from first principles rather than by analogy. The normal way we conduct our lives is we reason by analogy... With first principles, you boil things down to the most fundamental truths, and then reason up from there."
Elon Musk, in interview with Kevin Rose
CEOs, CTOs, and other tech leaders are constantly required to decide how much to adopt the opinions they receive. This implies that the average GitClear user has far more familiarity with "thinking for themselves" than the average Internet user. That's why we created this document. It's specifically written for those who feel comfortable using their own reasoning powers to understand what Diff Delta represents.
linkWhat does "thinking from first principles" actually mean?
James Clear describes what it means to "think from first principles":
A first principle is a basic assumption that cannot be deduced any further. Over two thousand years ago, Aristotle defined a first principle as “the first basis from which a thing is known.”
First principles thinking is a fancy way of saying “think like a scientist.” Scientists don’t assume anything. They start with questions like, What are we absolutely sure is true? What has been proven?
Consequently, this document succeeds in its purpose only to the extent it dispenses arguments that the reader can judge as absolutely true.
linkUnderstanding Diff Delta from First Principles
This article breaks down Diff Delta into the "small & obviously true" tenets that combine to imbue the metric with its utility. If the article succeeds at its goal, each section below should feel intuitively correct as a standalone. When combined, the sections should coalesce to inform a gut understanding of what Diff Delta is.
If this article is the reader's first introduction to "Diff Delta," the least you need to know is that it's a metric that correlates with the "meaningful change" or "cognitive energy" spent authoring code. Diff Delta is not a code productivity metric (why not?). It is a metric that approximates the extent to which code in the repo is durably evolving. "Durably" means that the changes being made don't get churned in the days or weeks following initial implementation (if they do, their prospective Diff Delta is negated). "Evolving" means that the metric instruments all code operations, and ascribes value in descending order to: legacy code deleted, non-legacy code deleted, legacy code updated, non-legacy code updated, code added, code find-and-replaced, code moved (zero Diff Delta), and code copy/pasted (negative Diff Delta).
linkOutcomes trend better when informed by data than feeling
We assert that any individual with decision-making experience recognizes that success is facilitated by discovering sources of truth that correlate with positive outcomes. Some popular sources of truth that businesses use to make decisions include "revenue," "customer satisfaction," and "tickets closed."
One way to prove this axiom is to consider the counterfactual. In the absence of trustworthy data, decisions get made basis of feelings, anecdotes, and group discussion. Decisions made via these conduits can beget a successful outcome -- but even when they do, the process that led to that decision can't be reliably reproduced for successive decisions. Making important decisions without data leaves a company's success reliant upon the tastes of its managers. Especially as the organization scales, "follow your feelings" can't be expected to produce consistent positive outcomes when plied by inexperienced decision makers.
First-principle truth: Successful organizations identify robust metrics that correlate with success (e.g., revenue, retention), and proliferate that data to guide Managers' decision-making.
linkHigh quality decision-making is enabled by understanding metrics' individual strengths & shortcomings
No single source of data answers every question. Every business metric, developer metric, or team metric will have a limit to its predictive powers. In part because, the more that a manager places focus on a particular metric, the harder their team will work to game the metric. Still, in spite of the limitations of any single metric, it's insufficient to set aside metrics generally, because then you're back to governing by moods and feelings. Consider the most popular developer metrics in use today:
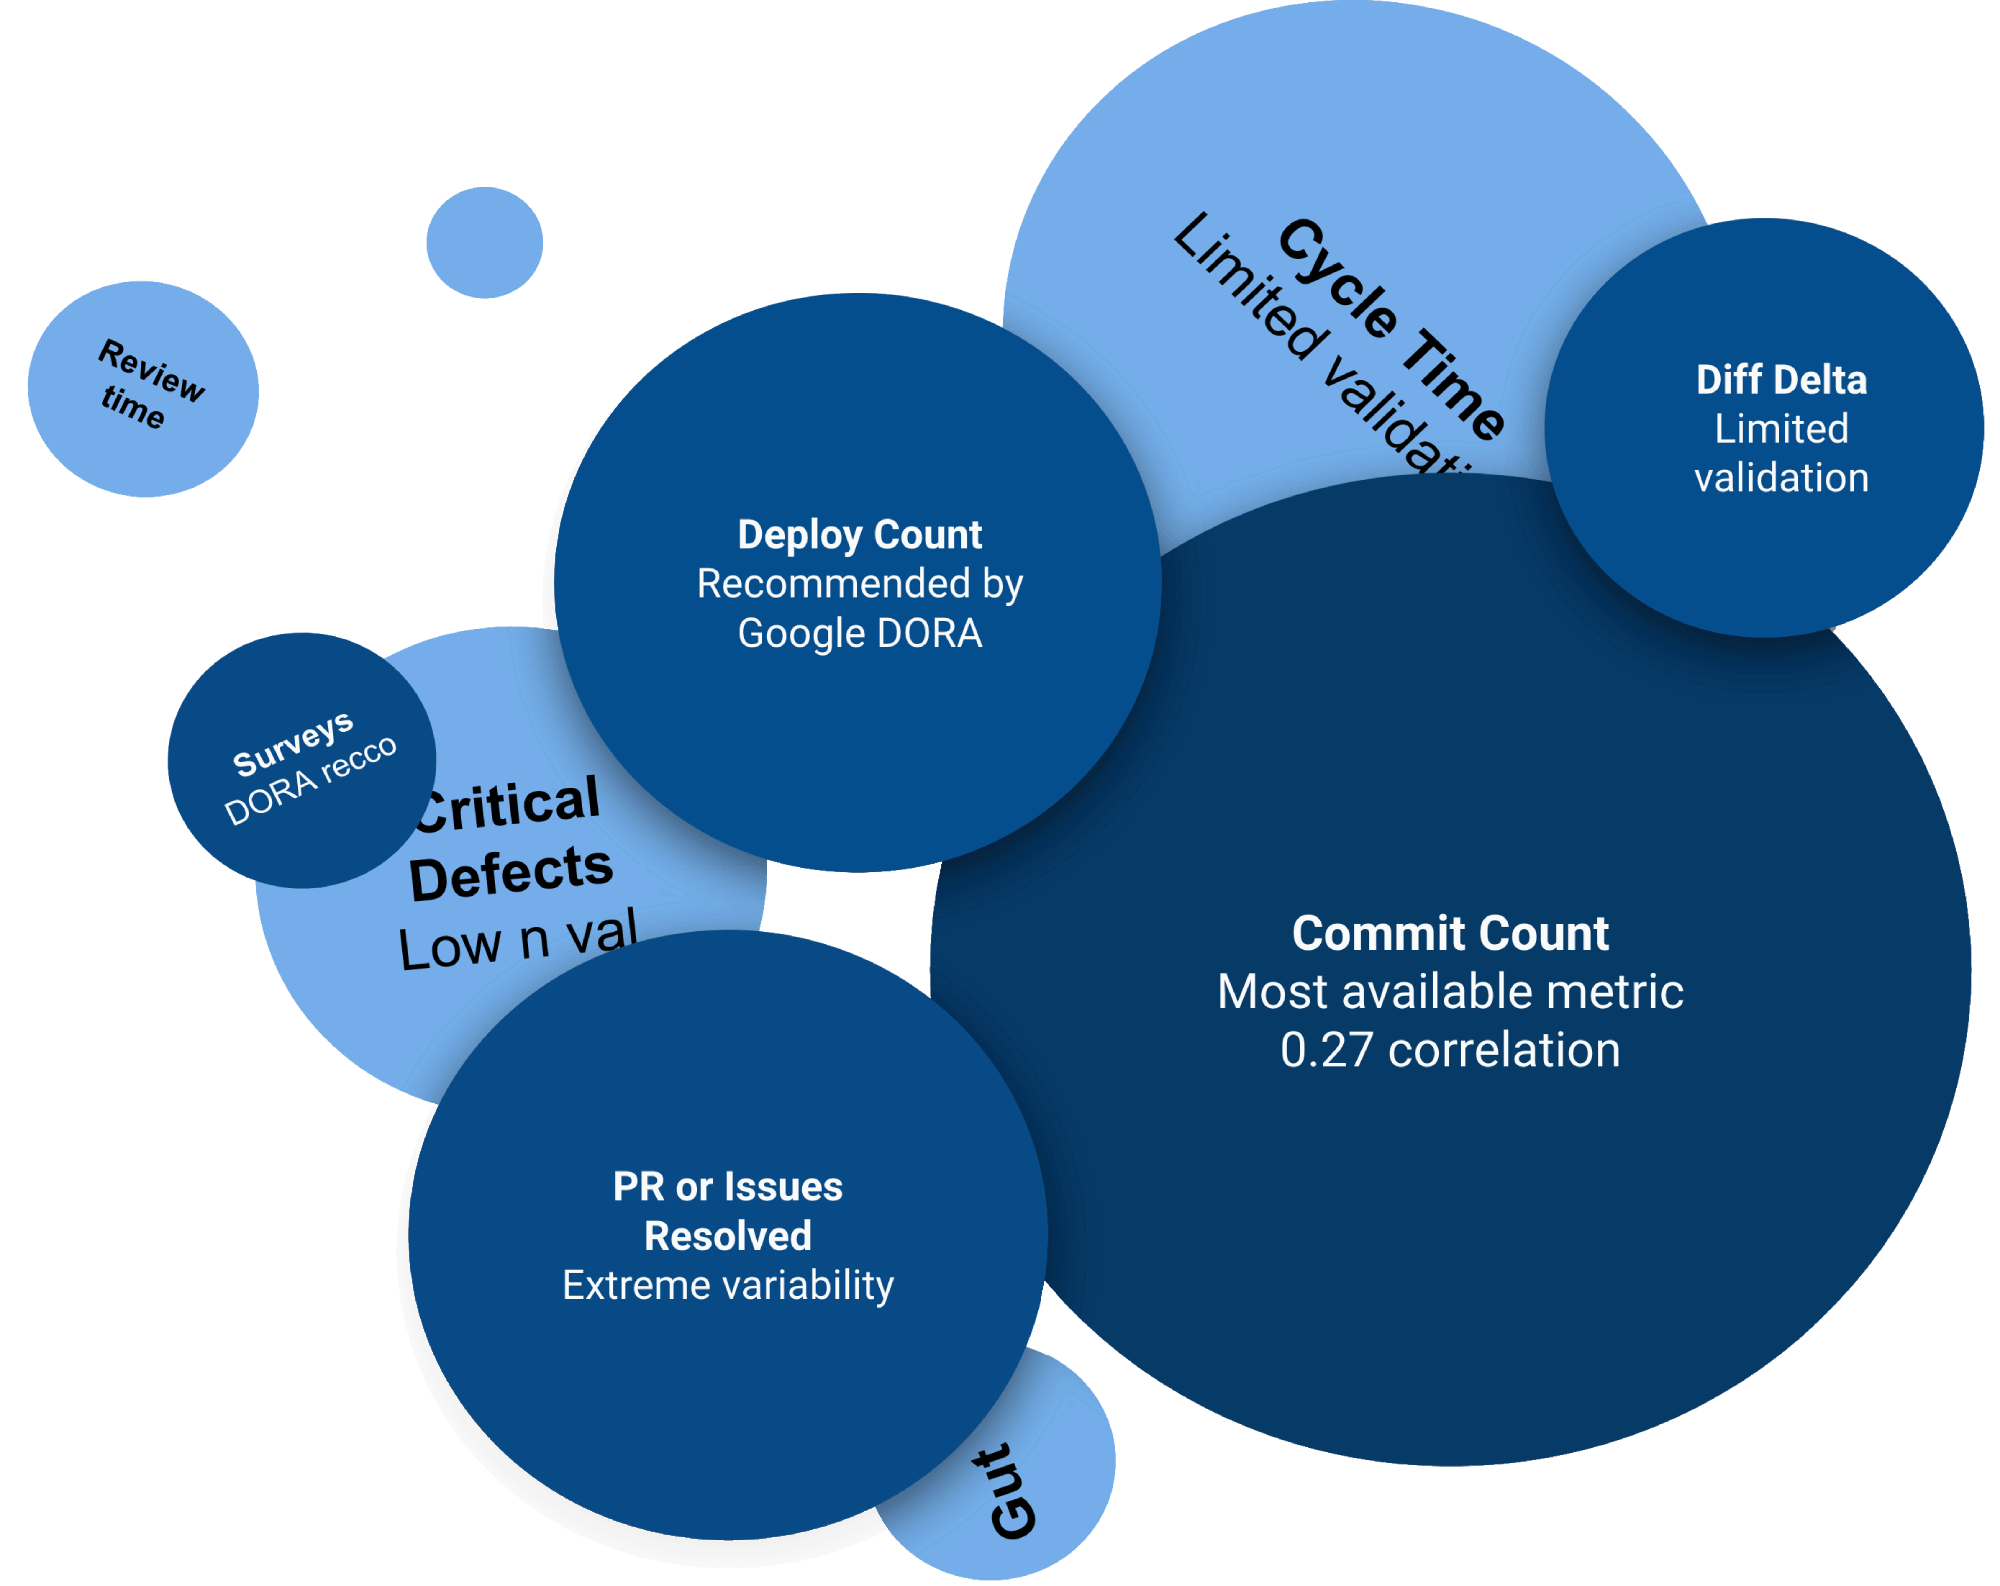
The landscape of "Best Metrics" is vast. Every source of truth has unique flaws & strengths to understand
The "Developer Productivity" articles that Twitter/X prefers are, more often than not, focused on the shortcomings of measurement (example). Unfortunately, in the real world, business leaders are constantly forced to make time-constrained judgements about when to hire, and what to pay. For these managers, it's not practical to ignore measurement. Among those who employ developers, whoever most accurately evaluates developer talent has a substantial advantage over their measurement-averse competitors.
So the authors arguing against developer metrics aren't wrong, per se. It's fair to contend that "using developer measurement to guide decisions is effective only to the extent one understand the limits of their preferred metric." Since no single metric perfectly -- or even strongly -- correlates with long-term product success, it's incumbent on managers to become sufficiently educated about which metrics are available, and which questions a particular metric is well-suited to answer.
First principle truth: There's no "silver bullet" developer metric. To make good decisions with data requires learning the toolbox of available developer metrics sufficiently well to recognize (+ explain to upper management) the power and limits of candidate metrics.
link"Commit Count," "Issues Resolved," and "PRs Open/PRs Closed" are unstable ("noisy") metrics
The claim that a unit of "commit" or "pull request" varies greatly is seldom disputed, so we'll keep this short. "Commit count," "Issues resolved," and "PRs resolved" are popular ways to approximate "developer energy," but they probably shouldn't be. To quantify just how noisy they are, here is a browsable data sheet with n=41,069 data points worth of commits, pull requests and issues. In these graphs, the blue bars are the average values for each metric, while the red bars are the standard deviation.
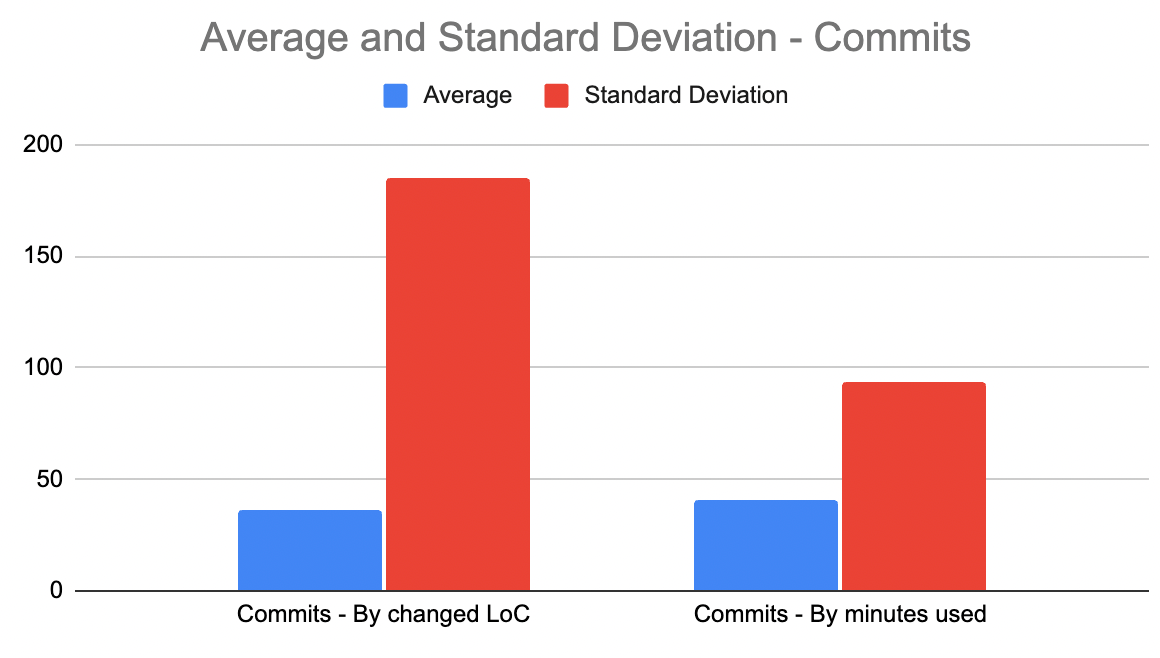 |  |
The relatively mammoth red bars give a sense for how much noise we're talking about here. The average work that goes into a commit, issue or pull request often varies by a factor of 10x or more.
Metric | Average | Standard Deviation | Sample count |
Commits - By changed LoC | 36 | 185 | 13,333 |
Commits - By minutes used | 41 | 93 | 10,000 |
Issues resolved - By commit count | 4 | 8 | 7,736 |
Pull requests resolved - By commit count | 5 | 12 | 10,000 |
None of these metrics have a standard deviation that isn't at least double the metrics' average value (!). Compare this to a more stable data set, like SAT scores, where standard deviation is only 20% the size of the average. If one tries using these dev metrics to evaluate progress, the resulting analysis projects to be around 10 parts noise (as manifest by the high Standard Deviation values) to every 1 part signal. Only when viewed over a long time window (1 year+) can a viewer hope to extract signal that isn't swamped by the high variance.
First principle truth: The most available git metrics have standard deviations greater than their average by at least 2x. Consequently, attempts to extract signal from these metrics on a timescale < 1 year is principally an exercise in quantifying randomness. This explains in part why so much of the X discourse re: developer measurement is skeptical or outright negative in tone.
linkHigh volume is key to measurement usable on a < 3 month time scale
Google's DORA metrics are arguably the most scientifically researched developer metrics ever. They segment teams into different levels of performance based on the following measurables:
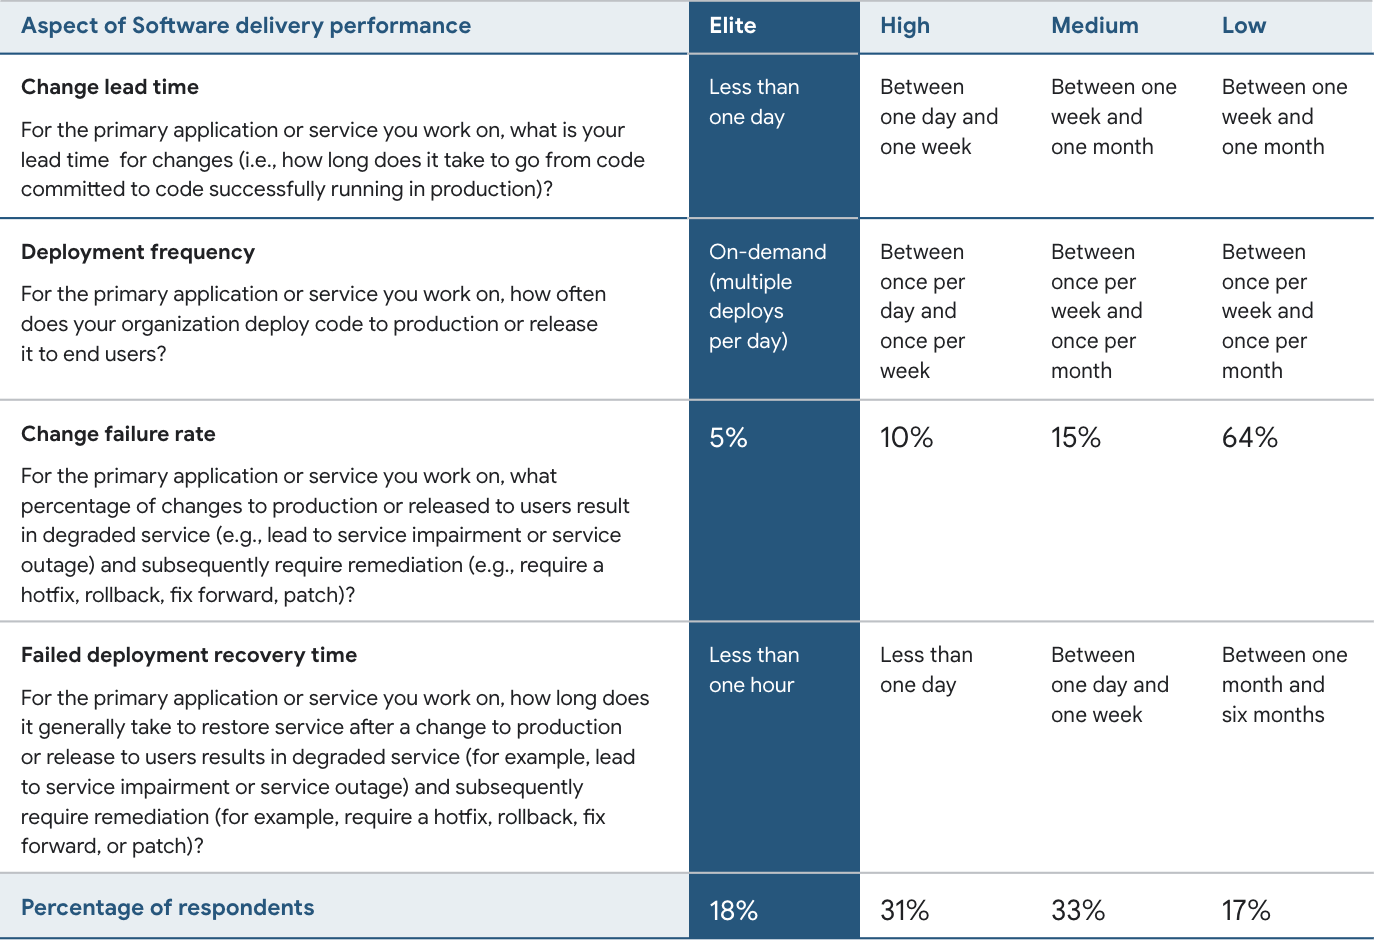
Teams can estimate their performance vs. comps and deduce where their team performance scores relative to competitors, which is very attractive to managers. Where these metrics fall short is their volume. To utilize any metric as a source of day-to-day truth, it must have a high enough volume that its standard deviation is similar to the actual deviation in how a team's output changes from day-to-day (i.e., how many minutes per day are available for undistracted coding).
Metrics like "Deploy Count," "Critical Defects," and "Failed Deploy Recovery Time," often accumulate 0-2 data points per team per day. Their rate of accumulation is so low that, for all but the largest enterprise companies, they carry all the same "high standard deviation" issues inherent to the metrics from the previous section.
For a developer measurement to reflect the impact of daily events, its value needs to be high enough that it's noticeable when it fluctuates by small amounts. If a metric is effectively approximating "developer energy," we would expect that its daily value shouldn't vary by more "minutes spent programming per day" will vary. Most managers expect that the time their developers spend coding every day should seldom fluctuate by more than 30-50%.
First principle truth: The Google DORA metrics are some of the most widely validated metrics ever studied. Still, they offer little value when viewed at increments less than 3 months, because they accumulate so slowly. It's effectively impossible to see how daily circumstances (e.g., company meeting, holidays) reflect on individual developers within the team with these metrics.
link"Changed Lines of Code” are the atoms that combine to become software products
Nobody that writes code would ask if unfiltered lines of code (henceforth, LoC) qualifies as a good metric. Common sense holds that it's the epitome of a "noise metric," and our data corroborates common sense.
But think about what is messy in the real world: Molecules. Organic chemistry. Quantum physics. Building blocks are not the substrate in which one lingers to facilitate high-level system comprehension. Rather, “building blocks” — in this case, changed lines — are a familiar starting point to kick off the journey that eventually extrapolates up to useful, high-level understanding.
Unlike PRs and Issues, which only capture a variable fraction of the team's work, LoC covers everything changing. If the ideal metric has to be present every day, for every critical defect, minor bug, or big new feature, LoC is the metric capable of affording such potential.
As with molecules and organic chemistry, it takes a concerted effort over years of research to piece together how these messy, abundant building units coalesce into recognizable objects. When it comes to “changed lines as building blocks,” this graphic uses 35 million database records to illustrate what noise GitClear leaves behind on the long road from LoC to Diff Delta:
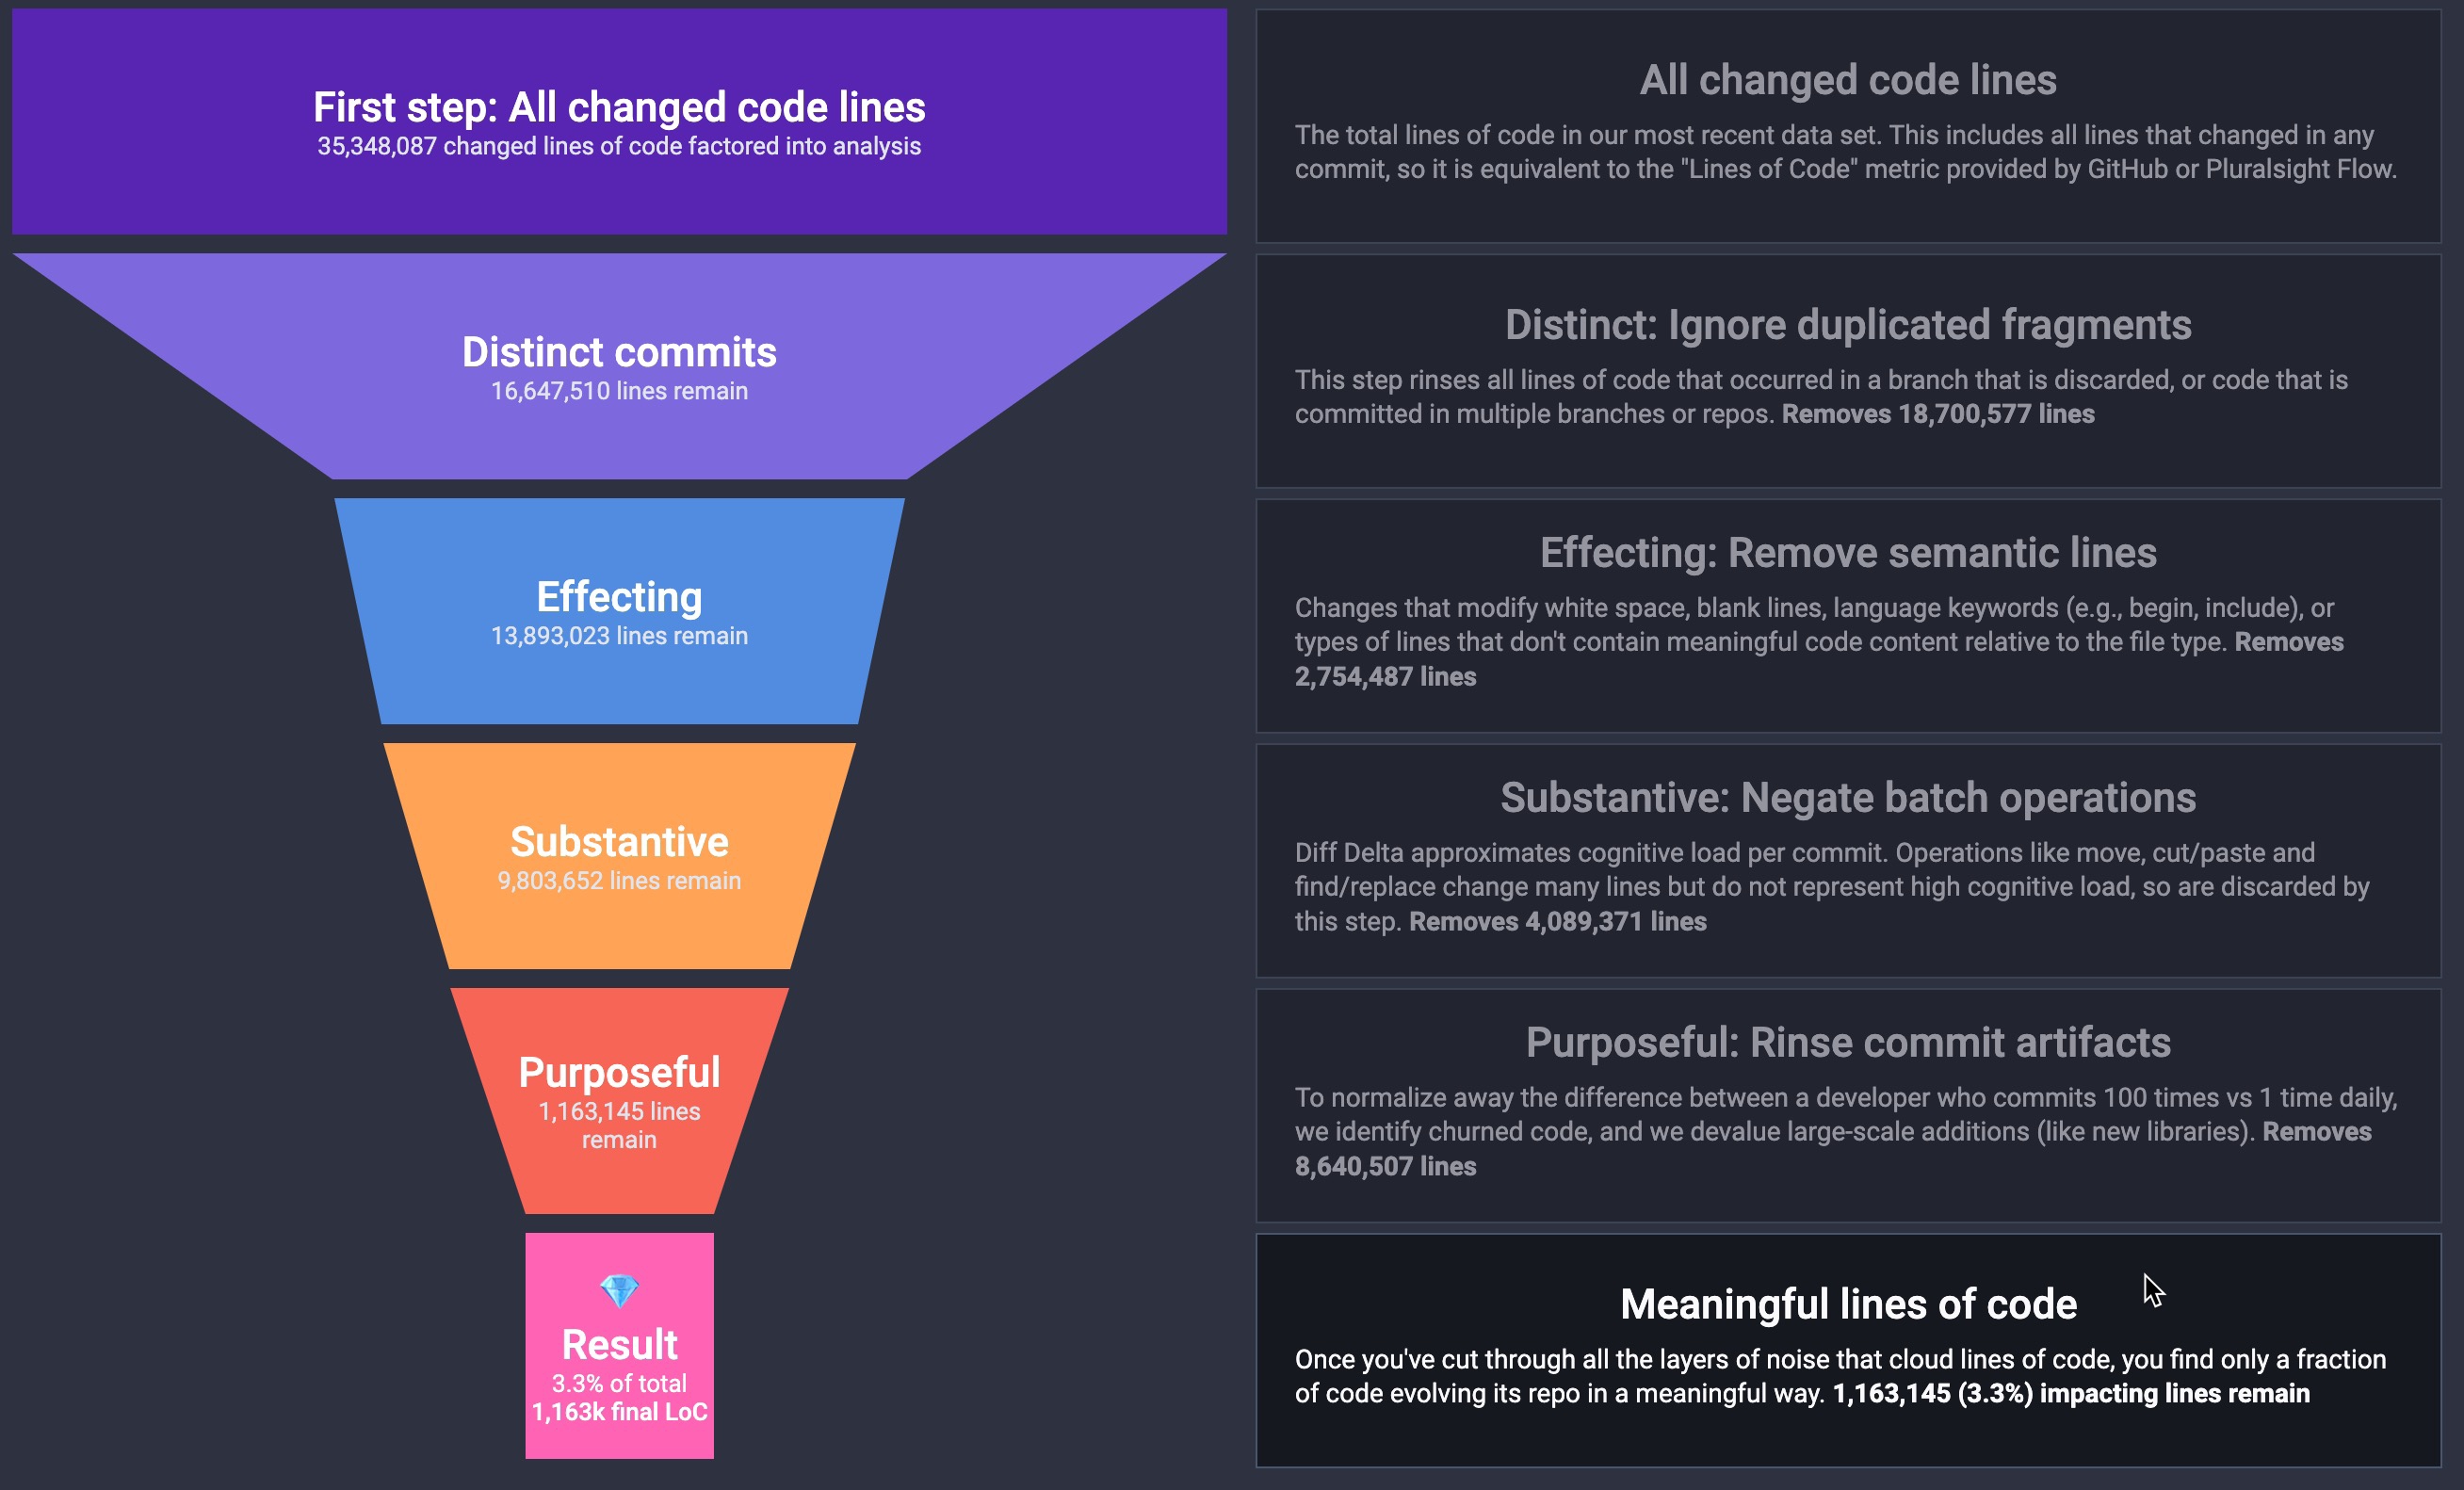
Click here to learn how code lines distill from their original state to the 3.3% that are meaningful
Our data proves that the default GitHub measurement of LoC is 95% noise, vs 3-5% durable, meaningful signal. No wonder that previous attempts to estimate programmer output from LoC have been derided as useless. It took 4 years to build the infrastructure to identify => exclude all these flavors of noise. Leave out any of these steps, and the resulting measurement will be off at least 2x.
First principle truth: The omnipresence of LoC makes it a perfect building block, but transforming the building block into business-usable signal is daunting, thanks to the 30-1 noise-to-signal ratio of LoC.
linkWhat signal is being measured when instrumenting a team's Diff Delta?
As the previous section establishes, "lines of code" are almost pure noise. But the good news is that, buried somewhere within that noise, LoC captures every meaningful change to code in your product. To get a visual sense for what that means, consider the following diff -- GitHub representation on the left, GitClear on the right:
 Open Source Diff in GitHub |  |
The GitClear version is much shorter, meaning it considers very few of these lines relevant. It cancels out (ignores) extraneous changed lines, including:
Keywords (e.g., end, })
Whitespace changes
Moved lines (30% of all changed lines)
Lines in auto-generated files (e.g., recordings of test http requests, XML files with a high density of alphanumeric sequences)
Code changes that are churned or reverted (either via git revert, or by subsequently re-adding code that had previously been deleted)
Lines in other types of non-human-generated files (e.g., Visual Studio .vcxproj files)
Branches that are never merged to the main branch
Copy/pasted code
Changes in duplicated commits (e.g., rebased commits, subrepo commits)
What is left is scored relative to how difficult the change was estimated to undertake. Examples of this follow in the next section.
First principle truth: Diff Delta distills "lines of code" to "meaningful lines" at a ratio around 30-to-1. To qualify as a "meaningful change," a line must have been human-authored, and must survive at least a couple weeks before being deleted or updated.
linkConclusion
Teams that utilize developer measurement to make decisions have a leg up over those that make decisions based on anecdotes and gut feeling. But every metric has a limit to its utility, and many of the most available metrics (commit count, PRs closed) double as the least stable metrics -- at least when viewed on a time horizon less than “months.”
Although few users have the time or masochistic streak needed to fully explain how to strip LoC down to Diff Delta, it’s sufficient to understand that Diff Delta is "lines of code" after scrubbing the 95% of changed lines that don’t constitute durable, meaningful change.”
The remaining lines are scored based on their estimated difficulty (more on that in the postscript below), leaving a measurement that correlates with "developer effort" at a rate higher than traditional metrics like "commit count" and "issues closed." For teams that want to get a sense for the volume of significant work happening per-week, Diff Delta is the only readily available metric with a high enough volume to detect small permutations in a team's velocity.
linkPostscript: What code changes deserve to be scored highest?
From first principles, it makes sense that the changed lines deemed "most valuable" would be the lines that took the most energy to change. Which lines are those?
Legacy code lines that are deleted or updated. It takes a lot of time/energy to deduce which legacy lines are no longer necessary/can be changed.
Other non-churned deleted/updated lines. The less old a line is, the more likely that it abides by the current conventions of the repo, making it less valuable than #1
Added lines. Writing lines doesn't require understanding precedents to the extent that #1 and #2 require. The value of an added line depends on the file type (e.g., CSS line = low, Python line = high) and file purpose (e.g., documentation, tests)
Churned lines. Lines that have changed within the last couple days (or within the current pull request), low value since they are an incremental stop on the way to the final code version
The harder the change, the greater the Diff Delta:
Deleted legacy lines can score up to 30 Diff Delta.
Other non-churned deleted lines can be 10-20 per line.
Added lines tend to range from 5-10 Diff Delta per line.
Churned code lines are in the 0-5 range.
If you would benefit from possessing a sense for how much difficult change has been durably implemented across your repos, GitClear offers perhaps the most substantively researched & iterated developer metric known to measure this quantity.
First principle truth: Diff Delta is engineered to be greatest when users are deleting lines and undertaking activities that will improve the long-term velocity of their product.