While it has only been a few months since our previous release update, it feels more like years. In January, we released our first research effort in the past year, and to say that “there is a lot of interest in how generative AI effects code quality” now seems like a quaint understatement.

GitClear's new research on AI generated code quality. Reviewed in depth by ThePrimeTime on Youtube.
Perhaps what made our research resonate in so many corners was that teams are starting to notice the signals that duplicated code has become more prevalent than ever? That is a narrative that would accord with the data we analyzed.
But, until this month's release, GitClear customers lacked a direct means to analyze when and where duplicated code changes were happening. This blog post marks the beginning of our public effort to become the best solution for teams seeking data to substantiate “if” and “how” a decline in quality is happening in their own repos.
Our new Code Quality graphs (and help section) are just the start of what we have changed and upgraded since our previous update post 3 months ago. Here's the full rundown.
link🛡️ New Code Quality measurements
In our research, we pinpointed three measures by which code quality seemed to be declining since late 2022: "Copy/Paste lines" percent of all changed lines, "Moved lines" percent, and churn percent (lines that substantially changed or were deleted within 2 weeks of being committed and pushed). All of these charts are now live, available within the "Issues & Quality" tab.
linkCopy/Paste (Duplicate) and Moved Line change percent
The two that seemed most anomalous are now live to view in the “Issues & Quality” tab:
Percent of Copy/Paste line changes. It is widely recognized that duplicated code leaves a profound challenge to future code maintainers. We now show users both i. What percentage of their team’s changes are Copy/Paste? ii. How does this compare to industry norms?
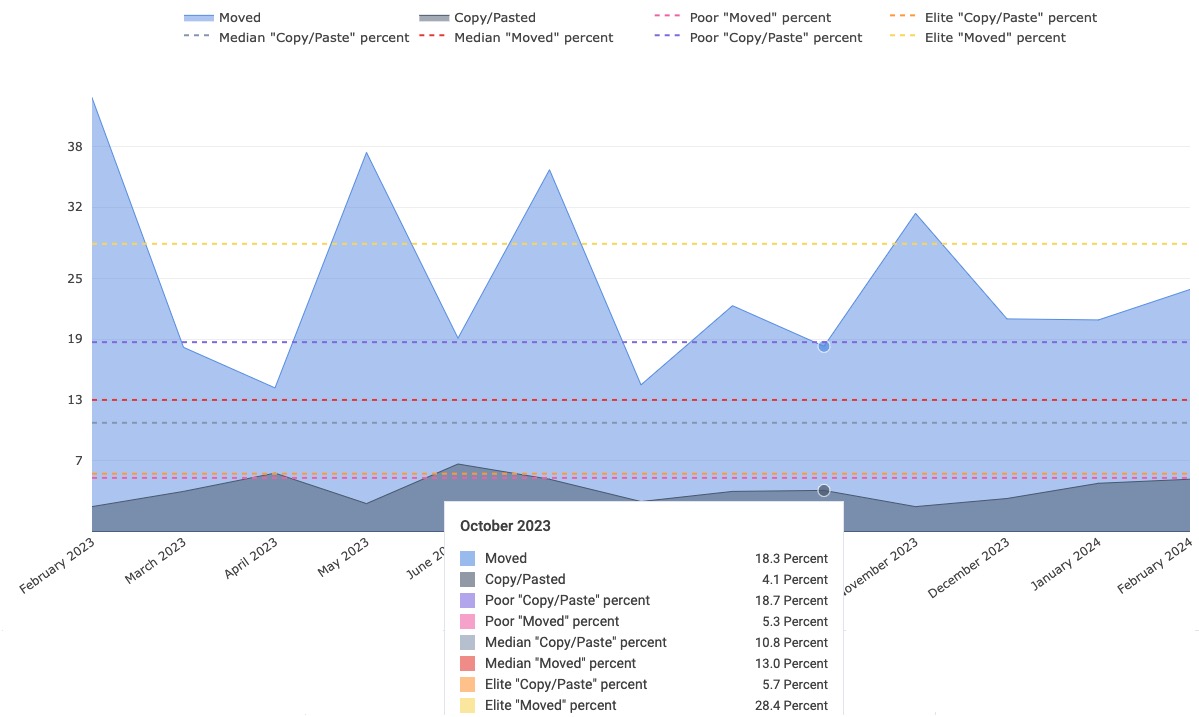
See how your percent of Copy/Paste and Move code compares to the industry median
Percent of changes that involved Moved code. In the past, we have treated moved code as a benign artifact of an evolving repo. Since undertaking our research, we have come to recognize that it isn’t completely benign. If your team has less than 20% of its code changes dedicated to relocating code, there is a good chance that you are not reusing much of the team's past work. As with above, we will show you how your “Moved line” percent compares to industry averages.
Help page that covers this graph in more depth is now available here.
linkBug Work Percent graph (including industry percentiles)
We have always allowed teams to see what percentage of their code progress effort is spent on fixing Jira tickets labeled "bugs." But as our research has proven, more than half of the regular team's bug fixing work happens outside the context of Jira tickets. Now, we offer a graph so that teams can better tease out the true, full cost of bug fixing compared to other types of work.
The Bug Work Percent graph also allows comparing your team's bug work percent vs industry averages. Every product has bugs. By design, teams often iterate features, launching proto-features to test adoption, and cleaning up the bugs from it later. The real question is “how does the amount of time we are spending on bugs compare to our competition?” We now spell this out for all teams that have opted into sharing their anonymized stats.

Comparing GitClear Bug Work Percent vs. Industry Median, and a standard deviation either direction
Across all teams we currently analyze, the average team spends about 13% of their code change energy (i.e., Diff Delta) cleaning up their past bugs. You can read more about the Bug Work Percent graph on its new help page.
link“Test” and “Documentation” work vs industry averages
Rounding out the code quality stats we’re debuting this quarter, you can now see what percentage of your team’s developer energy is being spent on the cornerstones that prevent a project from ossifying as years pass.

Comparing the percentage of Test and Documentation among total Diff Delta
Across all teams we currently analyze, about 18% and 3% are dedicated toward “Tests” and “Documentation,” respectively. Top performing teams spend an even-greater percentage of their total work in these domains.
link🏎️ Aggregated Per-Developer Velocity
This was quietly rolled out in December, but after a month in Beta, we are comfortable that being able to see the velocity stats on a per-developer basis is important to confirm a team is getting enough time for heads down, focus work. The per-developer stats are currently located in the "Velocity" tab, under "Per-Contributor Stats." They show graphs like this one:

These are the various repos that our parent company operates within. We do pretty well against the industry-average ~500 Diff Delta per developer per week (dashed blue line near bottom)
The unique utility of "per-contributor stats" is that they normalize changes in progress that result from growing or shrinking the size of the dev team. For the graphs shown on this page, the numerator for every graph data point (e.g., Diff Delta per code category, time spent coding, etc) is divided by the number of developers that were active during that interval.
As with the stats described above, we have added the means to compare your per-developer change speed against median comparable business, as well as business one standard deviation above and below the median software company.
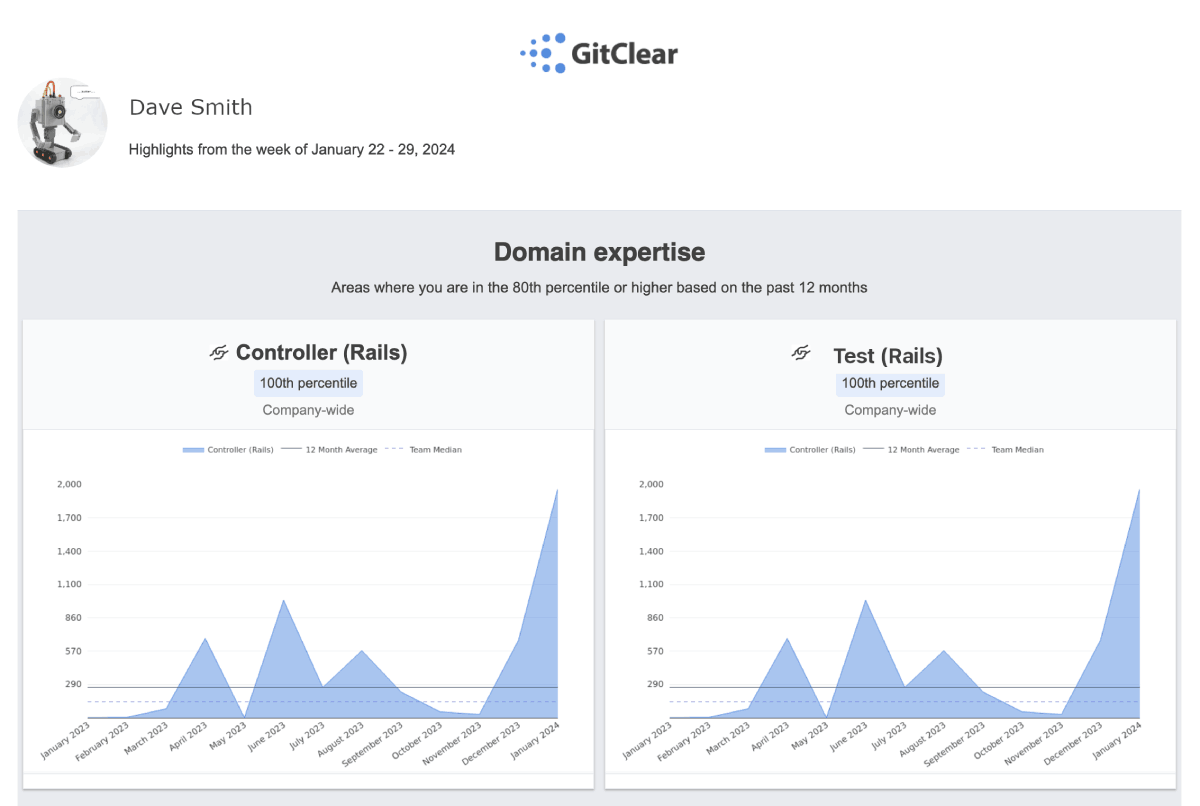
link🔦 Improved Highlights summarize achievements worth celebrating
All of these new metrics help shine light onto subtle changes that might be occurring in the quality or velocity of code delivered. But, combined with ~30 other reports that GitClear offers, we recognize that it can be intimidating, especially for new users, to figure out which reports deserve attention. Enter improved Highlight emails that now include graphs and median values:
Coming soon, we plan to allow individual contributors to highlight their most impressive feats to their managers. We believe that most developers receive too little affirmation when things are going well, and we want to offer teams a path to break this missed opportunity. It's our hope that these stats will also improve the retention of developers who do the hero’s work of cleaning up tech debt from departed contributors. ❤️💙🧡💜
link👜 Bag of Additional Improvements
Those are the headliner upgrades from Q1 to date, but we also squeezed in time for several more incremental upgrades on behalf of happier developers.
linkCommit group (pull request code review) improvements
We have fixed six different issues that could prevent large pull requests from successfully building. And we’ve got lots more improvements to pull request review up our sleeve for our next blog update in 2–3 months:
Code file change summary without providing an OpenAI token. Currently, commits, commit groups, and code files have their changes explained in English to facilitate faster review, but it requires providing an OpenAI API key as described here. Soon, customers with paid subscriptions will receive English change summaries from our own custom-tuned LLM, so your code will never leave GitClear’s local private network
Diff viewer only shows changes since previous review. Especially when reviewing large pull requests, it’s a drag to go through multiple review rounds, where the later review is largely spent trying to remember which parts of a changed file were already considered, and which changes are new (in response to reviewer feedback). In the next few weeks, we will automatically generate file diffs that don’t show changes that were already considered. We hope this will speed up review of large PRs by 10% or more.
linkMention @committer in checkin message to keep stakeholders aware of relevant changes
It is now possible to mention a committer’s Github/Gitlab/Bitbucket user name to send them an email with a link to a commit when a developer makes a change they want their teammate(s) to know about. It is possible to mention multiple committers in a single commit.
The committer must be signed up on GitClear to receive the email notification. Inviting developers to an existing team is (and will always be) free.
linkNew research on how code quality is evolving in the era of Copilot
GitClear customers can download our new research at no cost: it analyzes how AI-generated code like Copilot has impacted code quality. It shows some concerning trends for teams that want to write code that remains pliable with passing years.
linkHours Coding Estimate graph
Per user request, we've added a graph that sums up estimated time spent programming over a chosen interval:

Approximate hours spent coding
You can read about the graph (and its current limitations) in more detail on its help page. This page also describes how you can improve the quality of your Hours Coding Estimate by using the new filter on the commits list, which allows filtering only commits that are lacking a minutes (or Diff Delta) estimate.
link🔮 What’s next?
Some of our priorities for the upcoming quarter include:
When reviewing pull request code, only show what has changed since past review. Rationale explained above.
Summarize file changes for a commit, commit group, or pull request. Technically we already do this, for customers who opt in and provide an OpenAI token. But, soon, we will provide a fine-tuned code summarizer that works independently of external services.
Pull request industry stats. The same improvements that we have made to show comparable performance on the code quality graphs will be extended to the pull request graphs, where relevant.
ISO 27001 Certification. We have been working on this one for the better part of the past year and we’re now in the home stretch of undertaking our audits. We have also paid for and set up a timeline for securing our SOC 2 Type 2 accreditation within the coming months.
Open Repo improvements. We've added several new repos for analysis in the past 3 months: Xen, Istio, Elasticsearch, Nextcloud Server, Pandas, and Polars. We plan to incorporate PR reviews into the suite of tools we offer (free, as always) to open source projects with large communities. We believe we have a lot to offer to teams like Chromium (where several developers have already signed up for free accounts).
Thanks to everyone for your continued support, if you’re new around here feel free to drop us a line hello@gitclear.com if you have any questions, hopes, or product demos that you would like to chat with us about? 🤓