linkAuxiliary research
link🤨 🥈 🔮 🧵 💁 🧶 🏆 🎯 🚧 ⚔️ 🙅
linkFinal source of truth lives in code: this is a draft
Programming Note: the final version of this content is in source control and published here.
When people talk about metrics, there are two popular quotes often trotted out:
What's measured improves. -Peter Drucker
And
When a measure becomes a target, it ceases to be a good measure. -Goodhart's Law
Both of these aptly describe software engineering measurement, and yet the distance between them couldn't be any further. How to reconcile two accurate, yet diametrically opposed, results of measuring? It is the difference between what metrics can do, and what metrics often end up doing.
It doesn't have to be this way. Thoughtfully chosen metrics can and do continue to work in spite of "becoming a target." In fact, a great metric is one that, the more an employee tries to "game the system," the more the business' long-term interests are served. "Metrics that continue to work after being targeted" is another way to describe metrics that resist being gamed. So let's turn to look at how metrics are gamed.
linkMetrics must earn their keep in the busy real world
Any manager who has tried to pry more completed tickets from their engineering team knows the struggle. They want to take fair, data-backed actions that improve their velocity. They know that making decisions based on gut instincts is expensive and unscalable. Yet, when they look at their to-do list, it's full of tasks that seem more pressing than "improve measurement." In practice, embracing measurement often happens after a catastrophic failure, like a buggy release build or noticing a developer hasn't closed any tickets in a month.
Even when it's clear that measurement needs to happen, it's ambiguous where to start. You can Google "software engineering metrics," read the entire first page of results, and remain unclear about how to convert their proposed metrics from theory to practice. Take the metric "Team Velocity" as an example. Almost every Google result recommends measuring "Team Velocity," but nobody wants to say whether it's being measured in... tickets closed? Lines of code? Story points? Whatever it is, managers don't have time to figure it out. They need to get from this 5,000 foot mountain of theory down into something they can understand, trust, and benefit from... preferably immediately.
The organizing premise of this article is that you are a manager who wants to understand software engineering metrics just well enough to make your team more effective. Being a manager means you're too busy to learn about theory, except where it ties straight back to how you can benefit from that theory.
linkMetrics must be practical for real businesses to try out
Before writing this article, we digested the metrics proposed by the top 20 Google results in the domain of software metrics. As you might imagine, every source had their own theories about which metrics mattered most. Their articles often bucketed metrics into groups like "process metrics" and "project metrics." We'll follow their cue on grouping metrics, but our groups will be more basic: "quality metrics" and "everything else."
Here's what we posit makes a quality metric:
Business value. Is it possible to draw a line straight from this metric to business value created?
Measurable. Can we define a specific number and its units of measure (e.g., points, percentage), so that it can be tracked over time and correlated with events?
Actionable. Can it regularly be used to positive effect? Preferably with minimal false positives?
Available/convenient. Can an average software engineering team get access to this metric without changing their existing processes?
Popular. Does it have enough of a following to be well-documented and reliable?
Inclusion in the "Quality metrics" bucket requires all five of the above, plus a satisfactory answer to our stretch question: if we trust this metric, and developers subsequently optimize for it, what happens? In our time building and iterating our own metric ("Line Impact"), we've learned that toxic byproducts are an expected consequence of measurement, unless the metric is precisely aligned with long-term business value. As an example, we will show how developers trying to game the "Lead Time" metric cause reduced transparency for management.
linkQuality software engineering metrics
Here are five software metrics that satisfy all of the stated goals above.
link🏦 OKR-based
One of many example OKR templates available via Weekdone at Okrexamples.com

Any list that's focused on maximizing business value ought to start here. Leading companies like Google and Convoy use OKRs as a primary axis on which to evaluate senior engineers. The drawback of OKR-based metrics is that they are, by definition, specific to business particulars. This makes it impossible to generalize a formula by which to capture them, or to generalize the path by which they'll get gamed. More details.
How to game it? The risk of OKR's being gamed is low when they are business-centric, as is usually the case. The main danger of OKR-based metrics is that since they're typically formulated on a one-off (or periodic) basis, they may be less reliable than metrics that have been vetted over years. There are always possible edge cases lurking. For example, setting an OKR to "introduce less than 10 bugs per month" could be gamed by not launching any new features. Assuming both parties are acting in good faith, OKR gaming should be rare.
How to get it? Via existing measurement dashboards, or by working with companies like Weekdone who help provide OKR inspiration.
link🎲 Story Points
Story Point-based "release burndown" report, available via Jira

Story Points could lay claim to be the most "classic" of software engineering metrics. There are many different ways to calculate Story Points. All forms map back to an estimate of expected developer time to complete some task. Managers can use Story Points to calculate the costs implied by a task, e.g., developer earns $10k/month, ticket is estimated at 10 Story Points = half of month, so cost is $10,000 * 0.5 = $5,000. Using some version of that calculation helps prioritize tasks based on which yield the highest ratio of Projected value / Projected Implementation cost. More details.
How to game it? Most attention here belongs on how the Story Points get calculated. The easiest way to "game" Story Points is for the developer team to overestimate task complexity. One option to address this is to allow tasks to be selected in a "task marketplace," where overvalued tasks can be spread evenly between developers to maintain relative calibration. Another way to address it is to regularly recalibrate the constant used to translate Story Points into "developer days." Note that since the implementation of Story Points often differs by team, it's not advisable to use them to compare cross-team performance.
How to get it? Most any issue tracker this side of GitHub allows specifying Story Points. In terms of viewing them, Jira provides a "next-gen velocity report" dedicated to the purpose of showing Story Points completed over time. They also offer a "release burndown report" that uses Story Points to estimate how the team is tracking toward their goals for the sprint. GitClear also offers rudimentary (for the moment) graphs that relate Story Points completed over time.
link📐Line Impact
10 repos graphed by their Line Impact, a metric that quantifies the pace at which source code is evolving, available via GitClear
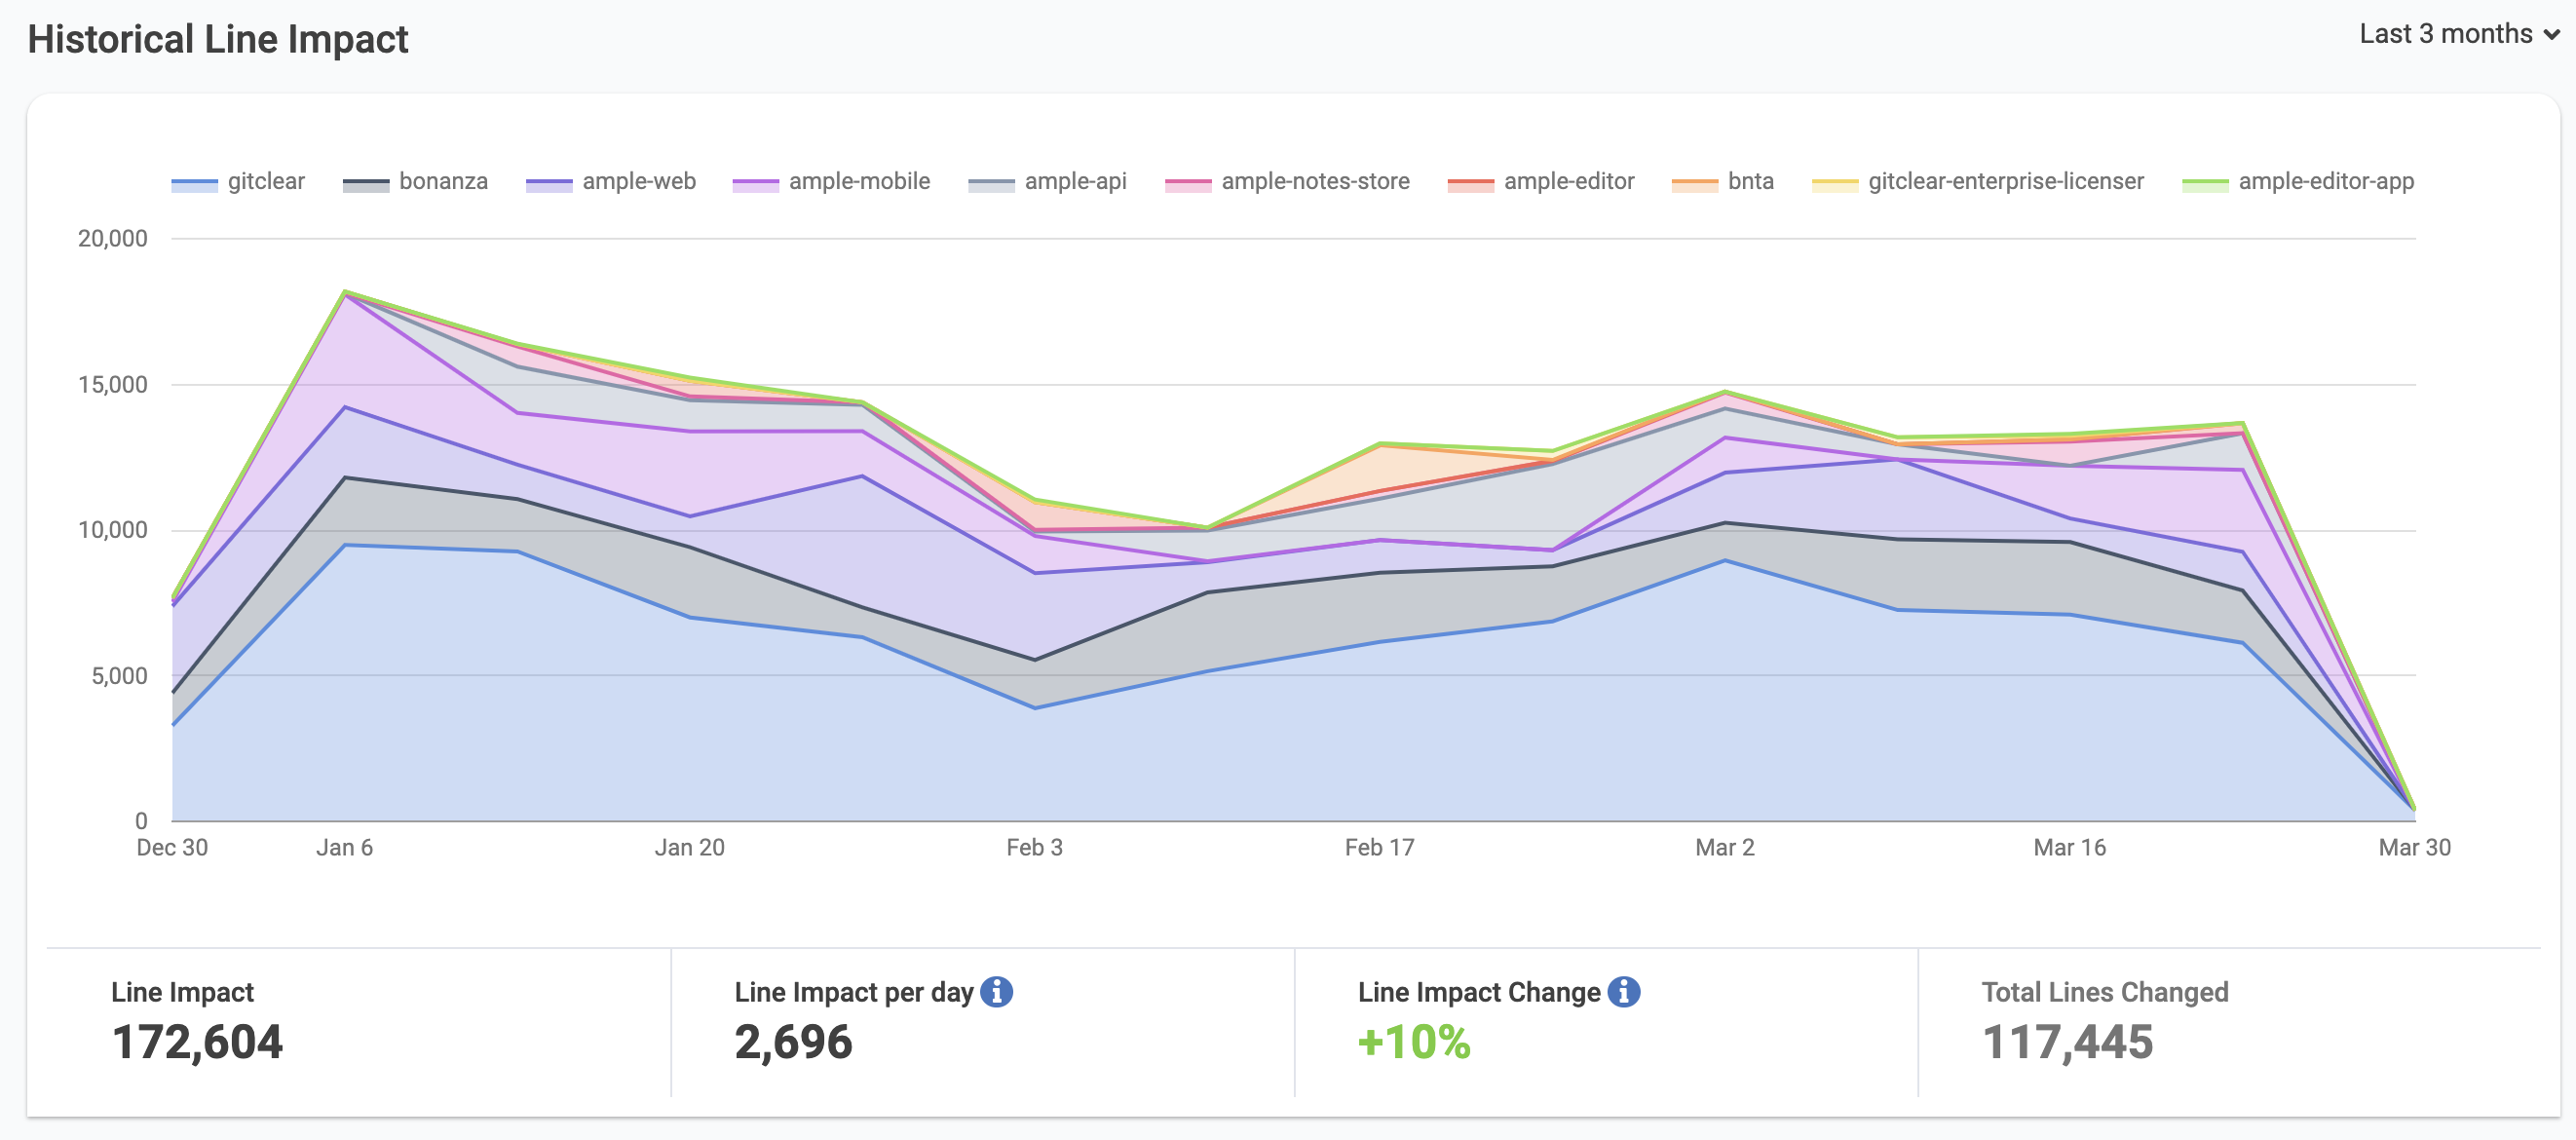
This GitClear metric was designed to measure how much each commit evolves the repo's code base. The GitClear Open Repos project, which processes code in 20+ cornerstone git repos (e.g., React, Tensorflow, Microsoft VS Code), serves as evidence that the metric offers stable interpretation of code across wide-ranging technologies (i.e., whether Javascript, C#, Python, PHP, full-time developers consistently average a stable amount of Line Impact per day). In terms of business value, Line Impact parallels Story Points: it can be used to estimate how the cost of a task varies depending on the developer to whom it is assigned. In fact, GitClear recently added the means to import Story Points with the promise to estimate task cost before a task is undertaken. Other details.
How to game it? Any metric that claims "Lines of Code" (LoC) as a data source (as Line Impact does) ought to be approached with initial skepticism. Subtle imperfections in processing get magnified into noise that crowds out signal. Our position is that any metric related to LoC ought to show the user how it interpreted their work using a diff viewer. Unless you can see how the metric was calculated on a per-commit, per-file basis, there is potential for metric gaming.
This makes GitClear's refined diff viewer a good first step toward sufficient transparency to prevent gaming. Additional protection comes in the form of notifications that get triggered when a developer contributes commits at an atypical velocity. As well, a per-committer graph of previous Line Impact makes it simple to visually spot if there are abnormal spikes in a user's contribution patterns. All these measures form a tapestry of safeguards that makes gaming unknown in the wild. That said, it would be disingenuous to claim that the metric is somehow impervious to gaming, so here is a list of known paths by which to accumulate rapid Line Impact.
How to get it? Free 15 day trial, then prices start around $30/developer/month. On prem version available.
link🐞 Bug Rate / Escaped Defects
Measuring how many bugs are created vs. resolved using Jira
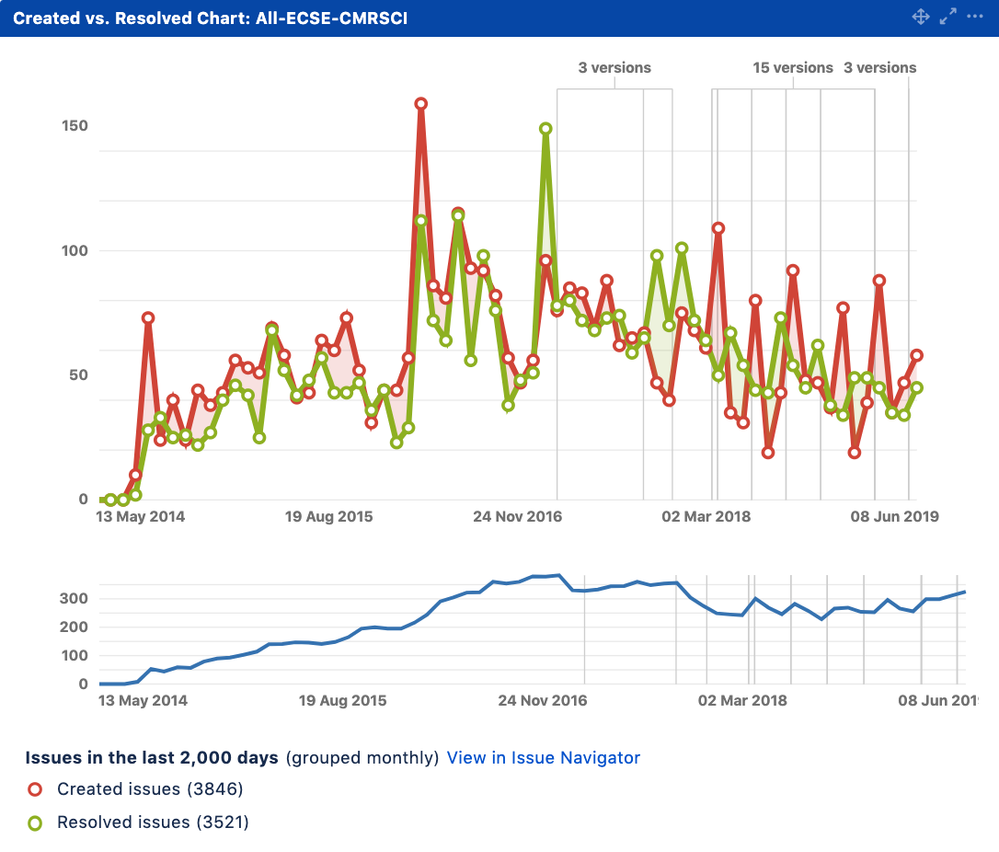
This metric is defined in various ways by various sources, but they all get at the same essential question: how many bugs are getting out into the world, and how well are we responding to them? Stackify relates it in specific numerical terms:
Your defect escape rate is expressed as a percentage based on how many defects you find before they get to production or how many make it to production, however you prefer. Every software project and team will be different, but we suggest striving to find 90% of all defects before they get to production.
Stackify's definition makes the assumption that one will designate a field in their issue tracker to capture what phase of development the bug occurred at. For teams that don't have the time to set up and track development phases, an substitute definition can be:
How often does code authored in a new feature become code changed in the course of resolving a bug?
A data-linked answer to this question is provided to GitClear users, but is difficult to calculate manually. A guaranteed-available fallback measurement of bug rate can be "what is the ratio of bugs created vs bugs resolved"? More details.
How to game it? This metric is difficult to game. A developer can handle more small tickets, but each ticket introduces an incremental risk of bugs if they don't know what they're doing. This metric does require a counterbalance for "progress" like Story Points or Line Impact, otherwise a developer could linger on a single issue for the entire sprint, ensuring a 0% bug rate.
How to get it? If your team has the bandwidth to label issues by the phase of development at which they occurred, then Escaped Defects can be manually calculated through any issue tracker. GitClear is another available option to calculate the percentage of features that become bugs.
link✅ Pull Request Completion Rate
A sampling of the pull request stats provided by GitClear

What percentage of pull requests were closed within a week of being opened? This rolls up several more granular questions, like "is the team engaged in responding promptly to new pull requests," "are they able to cooperate," and "have the developers polished their code before submitting it for merge?" More details.
How to game it? Acing the "Pull request completion rate" test means always closing PRs within a week. This is relatively hard to game, but it must be counterbalanced by a propulsive force such as Story Points or Line Impact, otherwise all of the team's incentives will be to polish work rather than ship it (or submit it for PR review).
How to get it? All of the "name brand" Engineering Insight providers (GitClear, Pluralsight, Code Climate, Pinpoint) offer stats that illustrate the efficiency of a team's pull request process. We help compare the providers here.
linkHonorable mention
While it is listed (twice) in Pluralsight's list of Top 5 Metrics, this is a metric that fails to stand up to concerted gaming efforts.
linkLead Time/Cycle Time
Lead Time graph as visualized via Azure Devops

"Lead Time" is most often defined as "What is the interval between when a task is filed in the issue tracker and when it is delivered to the customer?" Its cousin, "Cycle Time," is a subset of Lead Time, defined as "the time between when the product team plucked it out of the queue and when it reached production."
How to get it? Azure Devops Services provides the graph featured above. Jira offers a version of it. All of the major Engineering Insight offerings (GitClear, Pluralsight, Code Climate Velocity, Pinpoint) implement some version of Lead Time calculation.
How it gets gamed? Lead Time performance depends to some degree on the mechanism by which Jiras get filed, which means that its applicability across teams is low. Cycle Time hinges on the conventions by which the committer chooses to make their first commit. That makes this a metric that is trivial to game if a developer saves up their commits locally and releases them as one burst of work immediately before submitting the PR. This failure is what relegates Cycle Time to the "Honorable mentions" section. Also bad: by incentivizing a developer to save up their commits without pushing, it's impossible for teammates to intervene while that work is in progress. This side effect reduces transparency between a manager and their developers.
linkSubstandard metrics that didn't make the cut
The list above is relatively short compared to corpus of past metrics that have been proposed by other authors. For the sake of completeness, let's review some of the most commonly mentioned metrics elsewhere, and why they didn't make the cut.
Team Velocity. This was one of the most popular metrics advocated by other articles. It's championed by TechBeacon, InfoPulse, and SeaLights. However, authors seem extremely wary about defining the units of this important metric. TechBeacon defines it as "how many 'units' of software the team typically completes in an iteration." That's not tangible. InfoPulse doesn't try specifying units. SeaLights says the units are "Story Points." Thus, we conclude that the notion of "velocity" is adequately captured by Story Points or Line Impact.
Code Churn. The CEO of GitPrime (now acquired by Pluralsight) was among those who advocated for considering Code Churn. We argue in response that the implications of Code Churn are all over the map, which renders it near impossible to act on high churn. Metrics need to be actionable.
Release/Sprint Burndown. SeaLights and InfoPulse recommend paying attention to how a team is trending toward their sprint goals. We agree this is important, but it's already covered by the "Story Points" section above.
Test coverage. Some advocated that the percentage of code covered by tests should be included as a metric. This is a reasonable proposition, but 1) it's an incomplete solution. Adequate testing must include functional and integration tests alongside unit tests 2) it's very difficult to tie back to top-line business metrics. Test coverage is worth assessing as part of a Lead Developer's plan to monitor code quality, but it doesn't connect to business value directly enough to make the cut here. A better metric to track code defects that destroy business value is "Bug Rate / Escaped Defects."
Mean time to repair / Mean time between failures. Among the handful of articles that champion these metrics, none venture into describing what units the metric is based in, or what service can be used to gather these data points. Research finds that Atlassian offers a help article on the subject. If this article weren't already 2,500 words long, MTTR might make the "Honorable Mentions" section. But it isn't easy to tie back to business value, and it isn't straightforward for an average team to get access to without changing their routines.
linkDid we miss anything?
If you have a metric that meets our criteria above but isn't yet on the list, drop us a line in the comments section on our blog post.