Today we released the most feature most requested from our demos over the past year: the ability to group developers so that managers can compare like-with-like. In this blog, we'll review the details of how it works and what you can do with it. And so without further ado, let's jump straight in.
linkSetting up a team
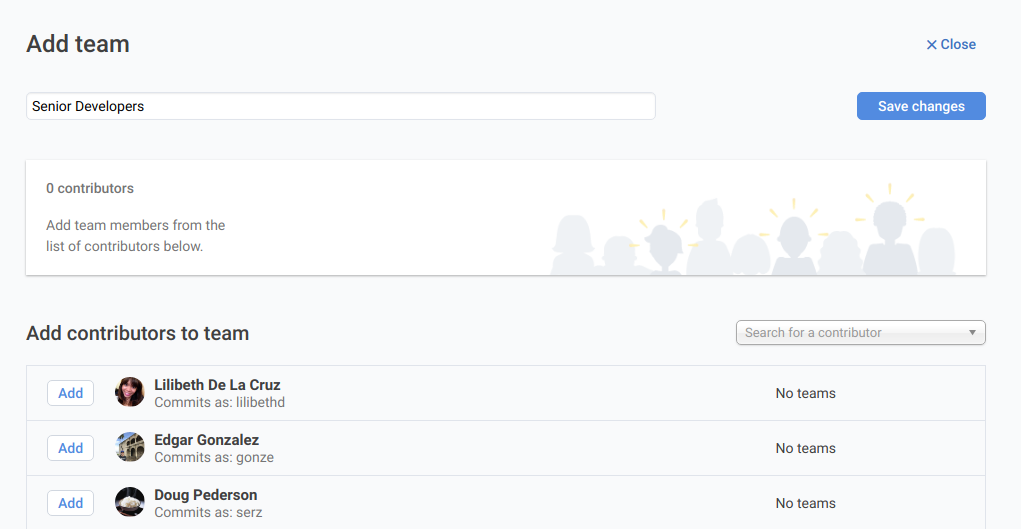
The first step in leveraging teams to compare developers is to setup the teams that your company recognizes. You can do this by visiting the "Teams" tab now available under the "Settings" menu. You'll then be presented the opportunity to name your team and add contributors:
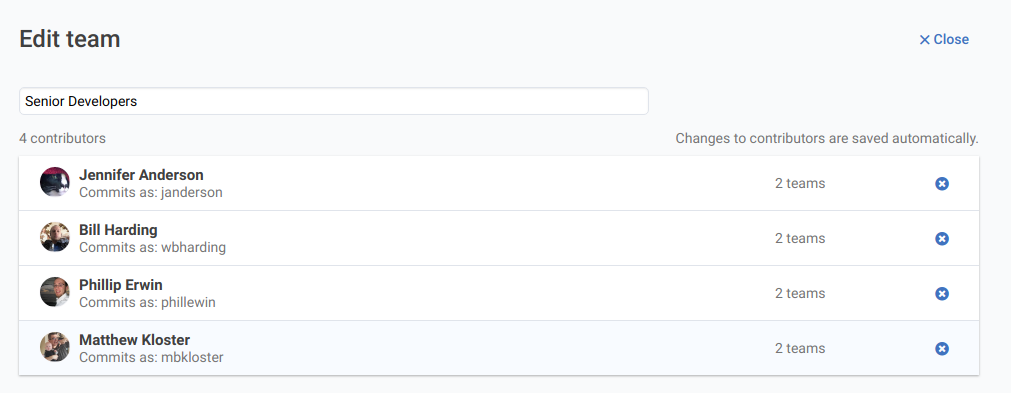
After adding committers to your team, you'll end up with something like this:
And now the real fun begins.
linkFiltering by team
Once you've setup a team, you can apply it to any report, in any context. The selector to filter on team (or "All contributors") is presented in the upper right side of every page. Picking it applies that team to the page results. For example, let's look at the recent commits from our Senior Developers team:
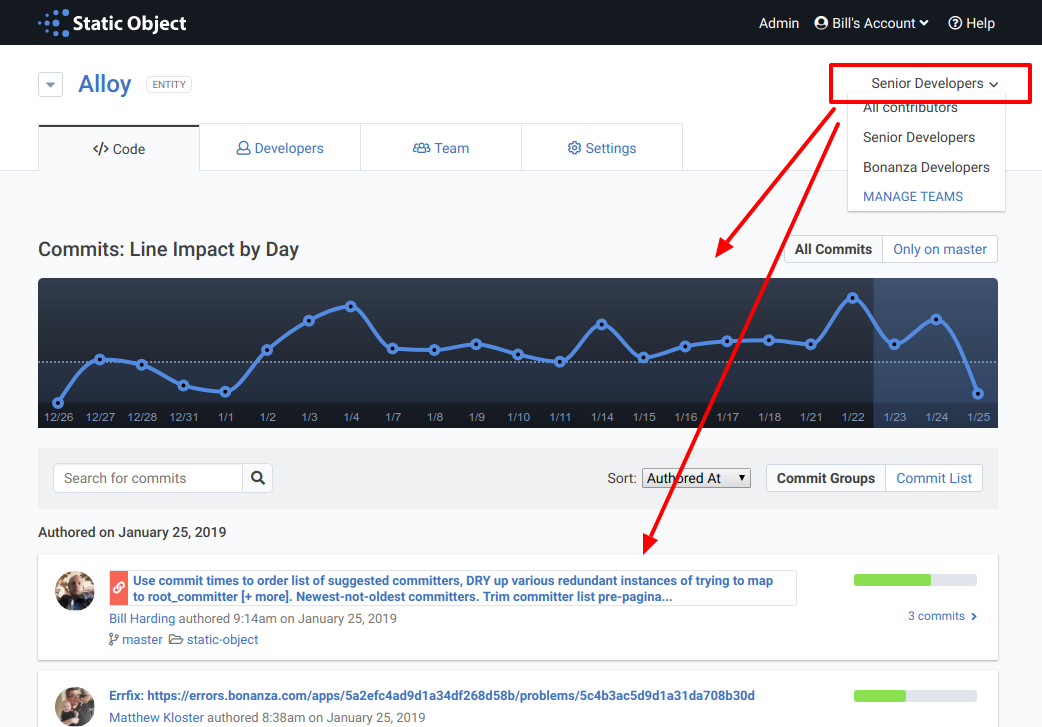
Both the Line Impact by Day, along with the commits themselves, consist only of those made by the Senior Developers team. Since our context is our company ("Alloy"), this shows commits from Senior Developers across the entire company. If we instead wanted to only see commits from Senior Developers within Bonanza, we can choose that context instead:
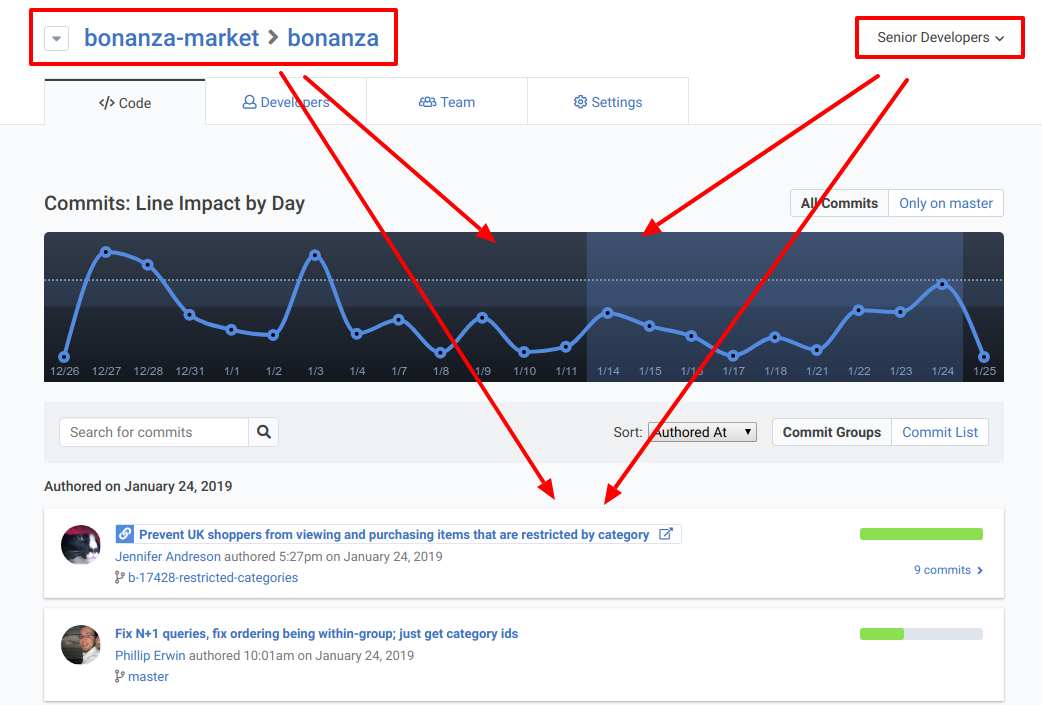
Now, the commits and Line Impact graph consist exclusively of the work done by Senior Committers working on the Bonanza repo. Cool! Now let's see what else we can do with this.
linkWhich developers are making the biggest impact lately?
The Active Developers page reveals the answer:

Since the context is the company ("Alloy") and the team is "Senior Developers," the stack ranked list cuts straight to the chase in being able to quantitatively compare the members of our Senior Developer team over the time period chosen.
linkHow does a new developer's work compare to teammates when they were new?
In Are You Sure You Hired the Right Developer?, we covered what makes it so maddeningly difficult to decipher a new developers output in less than six months post-hire. By putting a new developer on a team of their peers, you can use the Cohort Report to check how your new hire compares to past hires over the first few months.
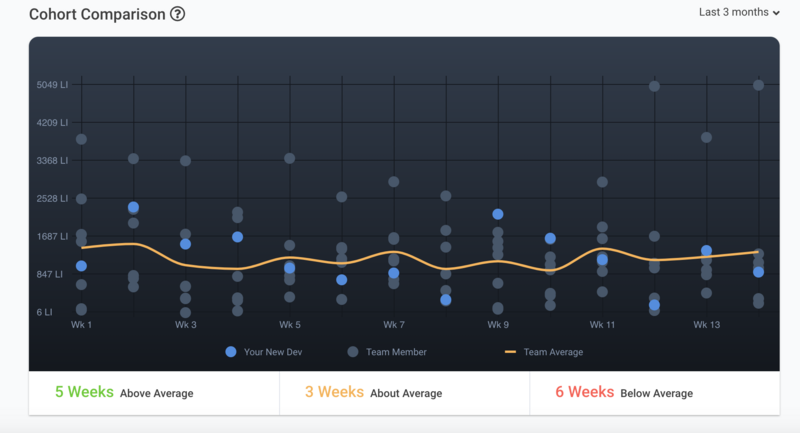
On this graph, we're comparing "Your New Dev" (the blue dot) with the team average (orange line) over the first three months of their work. Since we picked the new hire's Team (e.g., "Fresh College Grads") before applying this filter, the developer is compared only to past developers who had recently graduated -- not to others who may have been hired with more experience.
Using the combination of Teams + Cohort Report, you instantly visualize the typical ramp-up curve for a new graduate, and how that compares to that of "Your New Dev."
linkIdentify strengths relative to peers
Another opportunity to leverage Teams can be found on the Performance Review page. Here, you can assess how proficient a developer is in certain types of code relative to their peers:
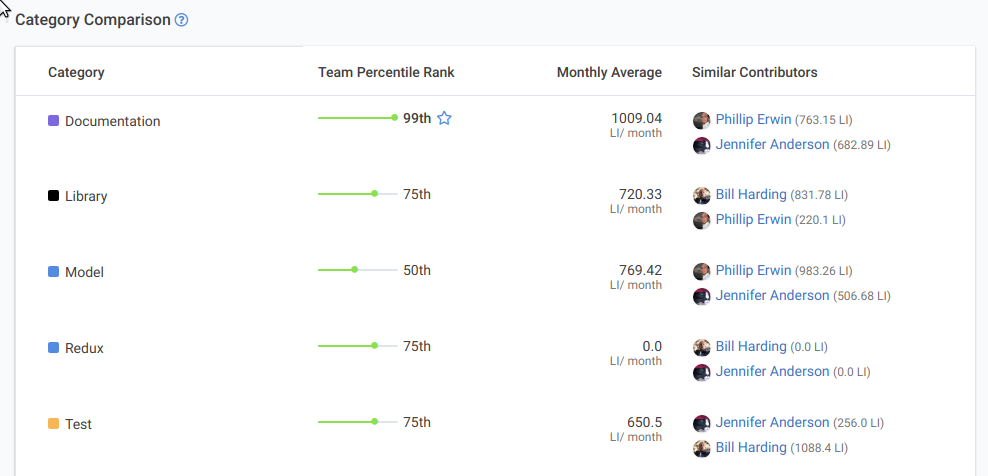
Compared to other Senior Developers, this developer is the legendary "rock star" when it comes to writing Documentation (thank God someone will do it!). When it comes to writing Model code, they're more middle of the road. So if you're a project manager with a task that will need to be reused by future teams, you would want to strongly consider this developer who excels at documentation. If you have a backend-heavy project, it's probably going to be heavy with Model code, so you might be better off picking Phillip Erwin, who scores 983 LI/month compared to this developer's 770 LI/month.
linkNow available in your account
These examples reflect only a few of the many use cases where Teams allows you to cut through the noise and achieve engineering transparency. We believe that the combination of being able to select context (i.e., repo, organization, company) AND team (i.e., "New Graduates," "Software Architects," "Senior Developers") can be a potent one-two punch to drill down to exactly the information you need to make good decisions. Try it out and let us know what you think via support@staticobject.com or the comments below!