The performance review page offers an assortment of stats showing an individual committer's performance over the past year. These stats are typically updated once daily, so will not reflect work done during the present day.
On this page you will find:
linkCommits Pending Review:
Our system analyses each commit for Line Impact, however, it is important to make sure our calculations match up to your values. Reviewing these commits for accuracy can improve the quality of the data used to provide these insights.
linkLine Impact Over Time:

Line Impact - A relative measure of commit value based on the changes made to the code. For more read: What is Line Impact and how does it work?
Days Active - Number of days a developer committed code
Velocity - Average Line Impact per day.
LI Change - The change in Line Impact compared to the individuals all-time average
linkTeam Comparison:

The team comparison offers a snapshot view of this developers Impact compared to their peers.
linkCategory Comparison
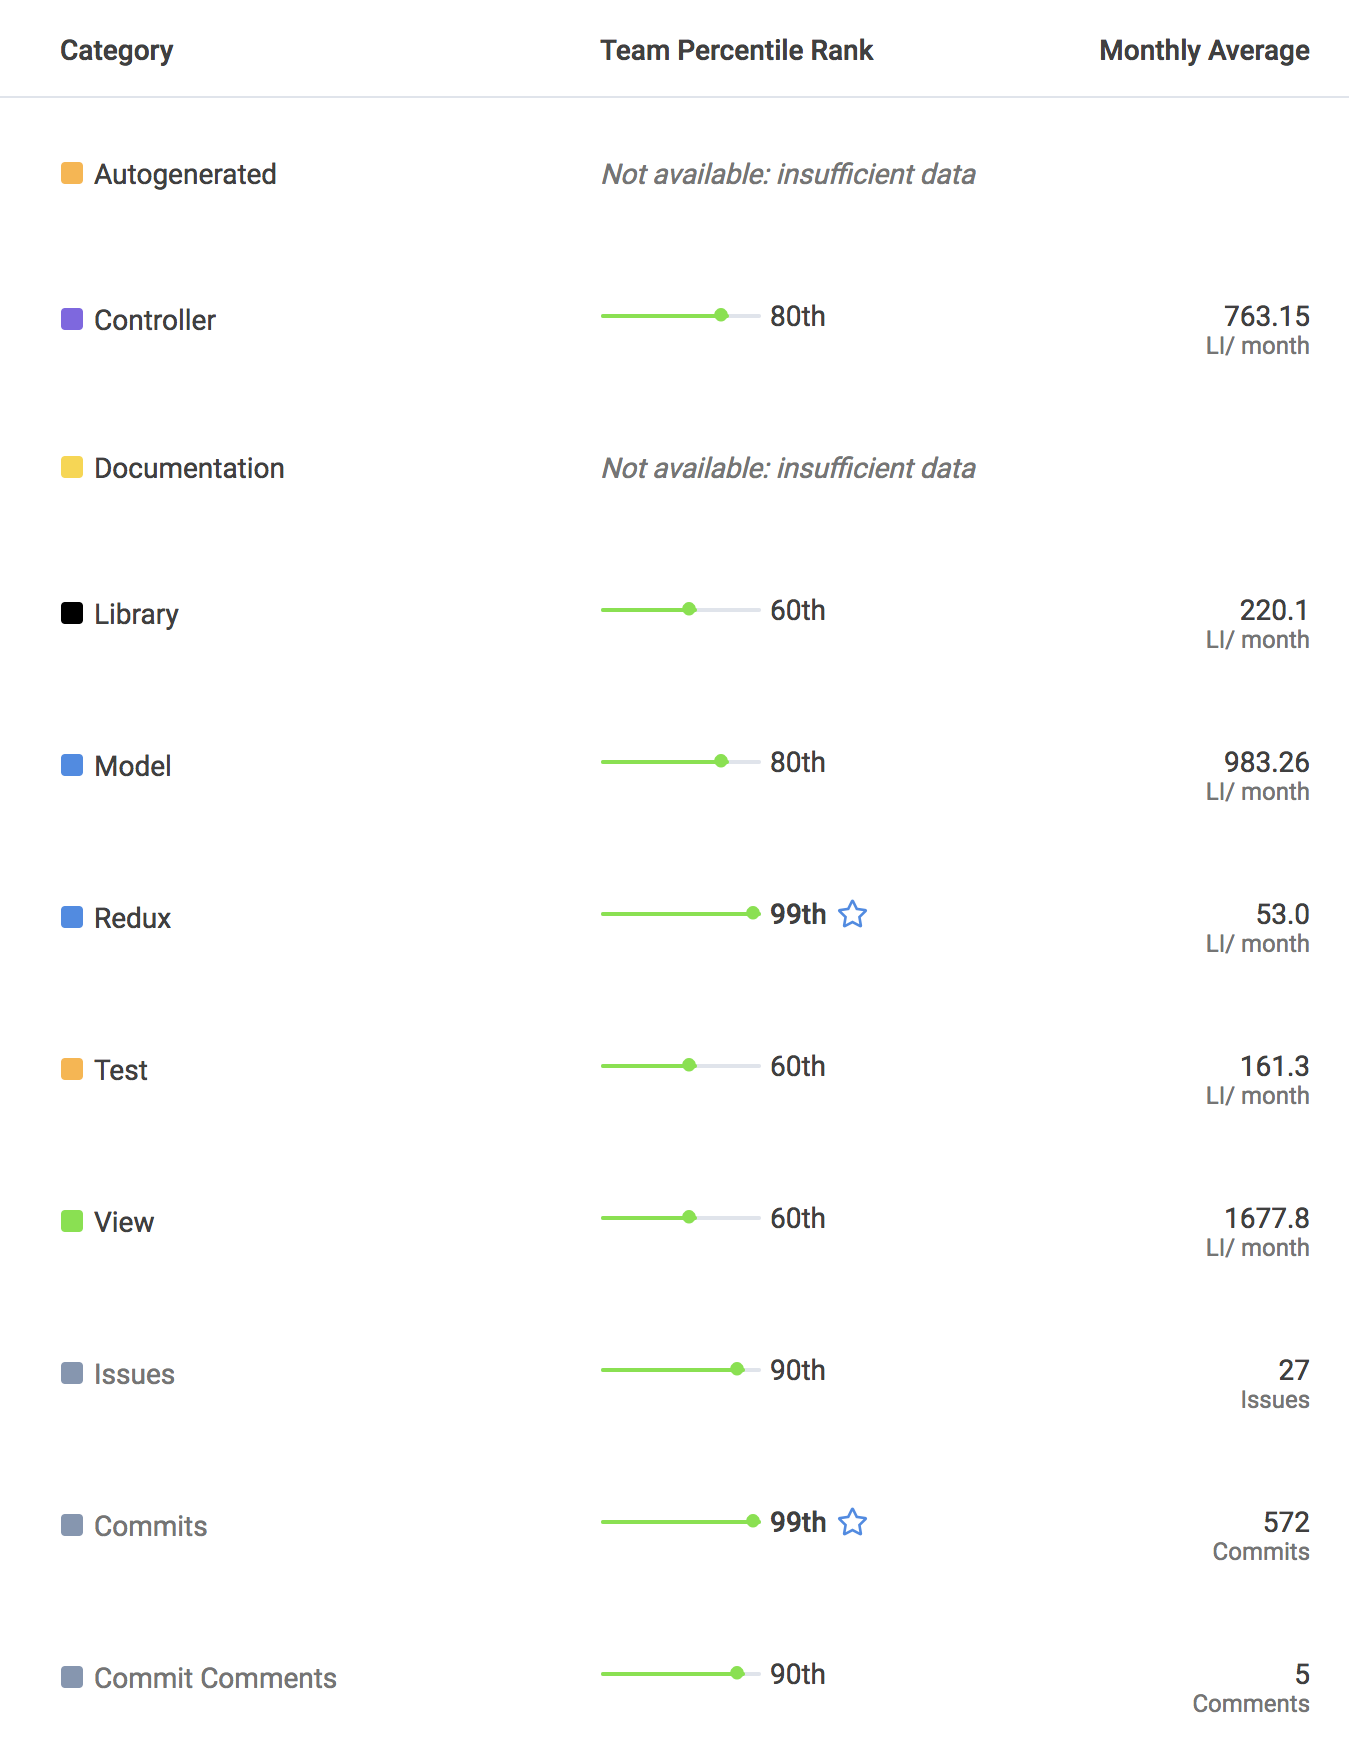
The category comparison shows a peer to peer comparison on a more granular level based on code categories that can be set up. Read More
linkTop Projects:

The top projects will show the largest projects worked on by the developer for each month. These projects can be connected to your issue mapping software to gain easy access to the context behind each project.
link
linkBadges:
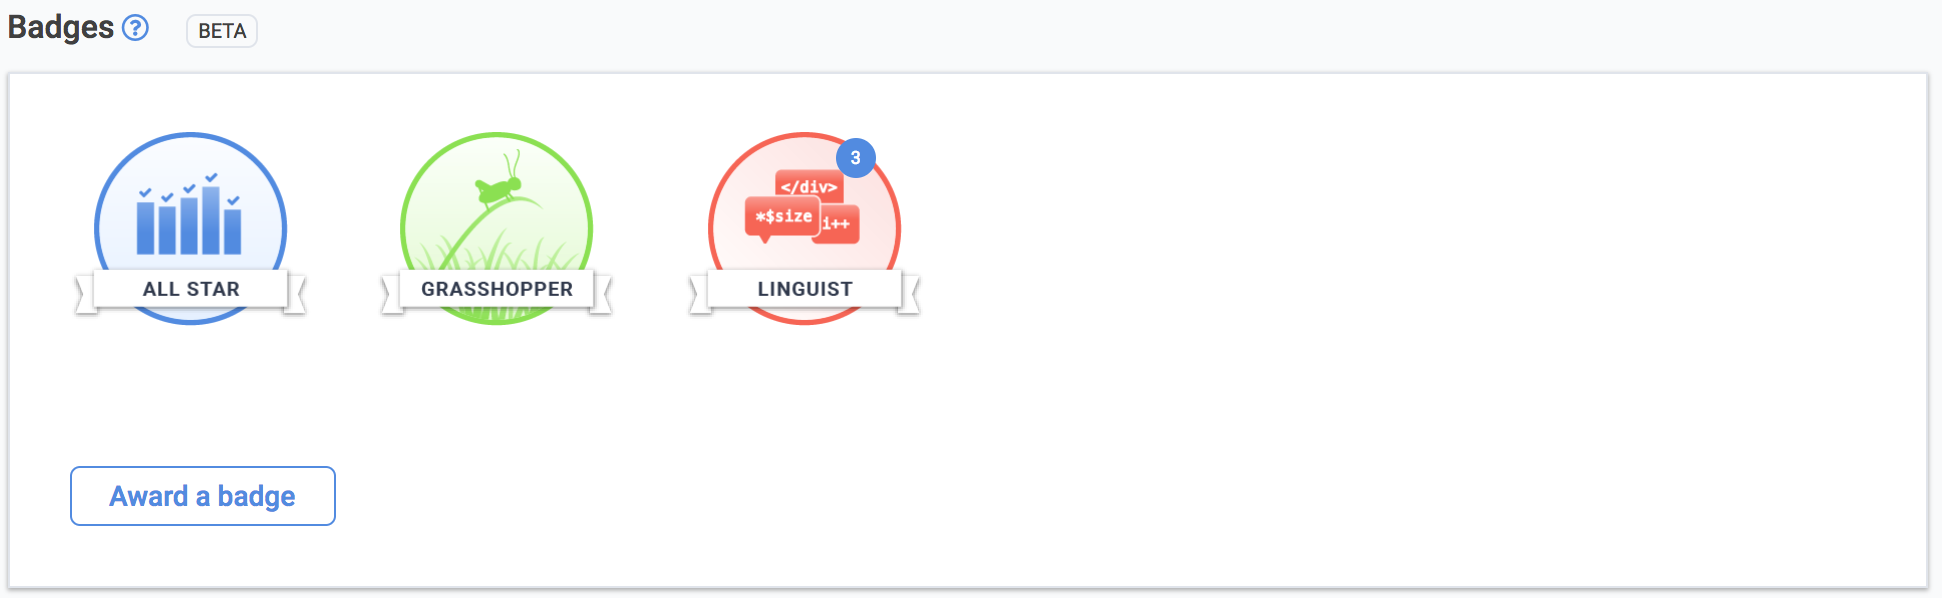
The performance review page is also the home of any badges that each developer has received. You can read more about badges here.
linkNotes:
The last section on the performance review page is an area to leave manager notes. These can either be visible or hidden from the developer.