As described in Method for extracting signal-rich commit count data: we recently undertook a data analysis exercise, out of pure curiosity, to visualize the frequency at which the average developer commits code. As we describe here, here, and here, we believe that using Commit Count as a metric to make decisions is a Bad Idea (kind of the whole reason this company exists 🙂). Still, this sort of data holds entertainment value for a certain kind of brain.
linkAnnual commits per developer
The takeaways depend on how one thresholds the bottom range of applicable years. We will divide our stats into two groups.
linkCommitters making 100+ commits per year (freelancers, open source, junior devs, and everyone else)
A minimum threshold of 100 commits per year implies that a developer must make a commit about once every four days. For full time developers, an annual commit count of 100 commits would imply that the developer is either junior, part-time, or otherwise struggling.
linkData table
We didn't spend a ton of time analyzing the "min 100 commits" dataset because it's less relatable to the real-world developers we have seen. In something like 50-100 developers our company has hired from the Seattle workforce over the past 15 years, there were only a couple full-timers that averaged less than 1,000 commits per year. Thus, the 1,000+ group held the most curiosity satisfaction potential, given our US-based lived experience.
linkCommitters making 1,000+ commits per year (seasoned full-time employees, expert freelancers)
A minimum threshold of 1,000 commits per year produces stats that feel more similar to what we've seen from the Seattle hiring pool:

Among the n=66,671 developer-years that met the criteria for inclusion in this data set, the median developer made 1,506 commits per year
Here we have show how many days per year this set of developers were active:

The median developer made a commit on 225 days per year. The mode (most common number of days worked per year) was 216 days. [n=66,671]
We were also curious what type of commit counts one might encounter in the upper echelons of the sample:
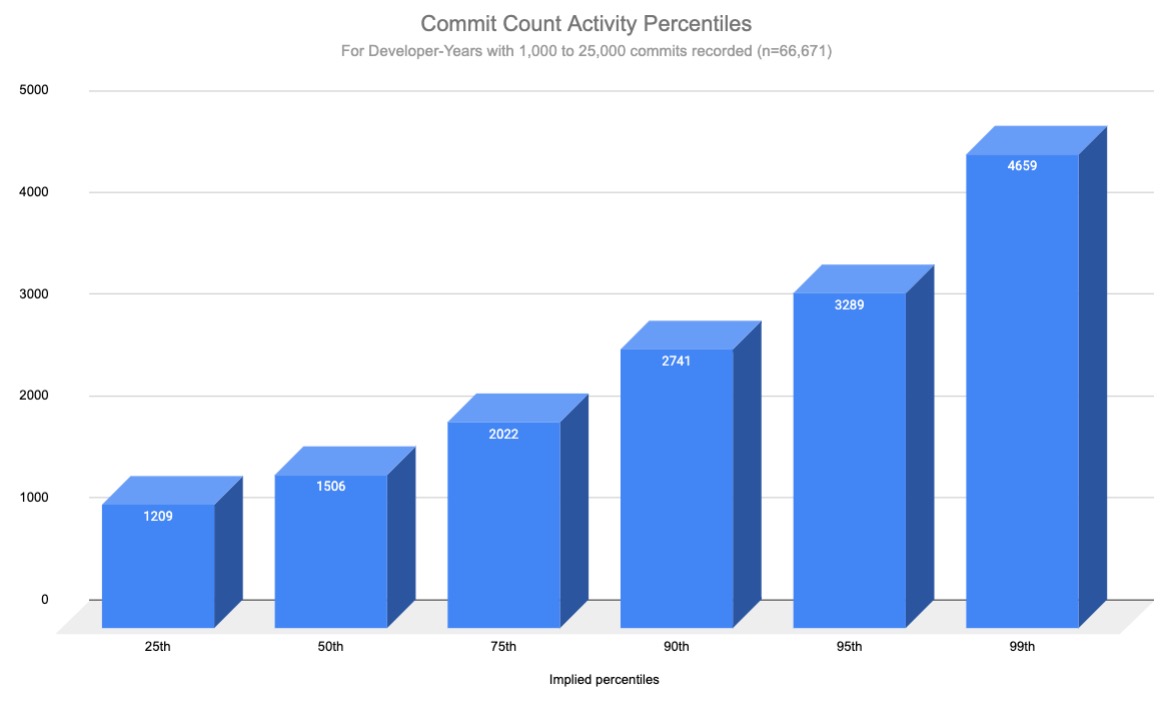
As mentioned previously, the median developer averaged 1,506 commits. The 99th percentile developer with 4,659 commits, which means there were 667 developer-years at or above 4,659. And then there was this this guy.
linkData table (throwback formatting can save a spreadsheet ♻️)
A perennial hobby of bored tech employees on the internet is to bicker about the possible existence of a "10x developer." According to the data we've gathered, the difference between a 25th percentile developer and a 99th percentile developer is about 4x. This would accord with our hiring experience.
The hunt for the "10x developer" isn't quite that simple though, because by zooming out to include all developers with 100+ commits annually, the delta between a 99th percentile Seattle developer and a 25th percentile global freelance developer nets out to about 20x. One hopes the ambiguity about what the bottom reference point should be will allow “whither the 🦄 🥷 dev?” debates to continue entertaining bored tech workers for centuries to come.
Google-formatted stats here, in the "Commit Count stats (min 1,000 annual)" tab.
linkThis data free for reuse
To the extent that the data above can serve your goals, feel free to cite it, but please consider the data “for entertainment purposes only”-quality, since that describes the spirit in which it was gathered. There will probably be a v3 analysis in the works later if people are interested by such data parlor tricks? 🎩