Product privacy is a luxury good. Since their acquisition to Atlassian, GetDX has been indulging in that luxury to an unprecedented degree, shuffling their public documentation & research into the Wayback Machine. Their transformation into a true Enterprise-first company leaves a void for aspiring Software Managers striving to find freely available public information on the Developer Analytic metrics most widely used in 2026.
GitClear is trying to fill the void by investing around 100 hours since 2025 writing & collecting screenshots for the 70+ metrics that make up the Developer Analytics Encyclopedia.
It has become an oft-linked page in its early existence. But since we live in a world where attention span reduces with every passing year, this is not an ideal solution for developers looking to get a quick sense for "What metrics matter most in 2026?"
Enter the freely shareable GitClear World Map of Developer Analytics (aka "The GitClear Atlas") of 2026:
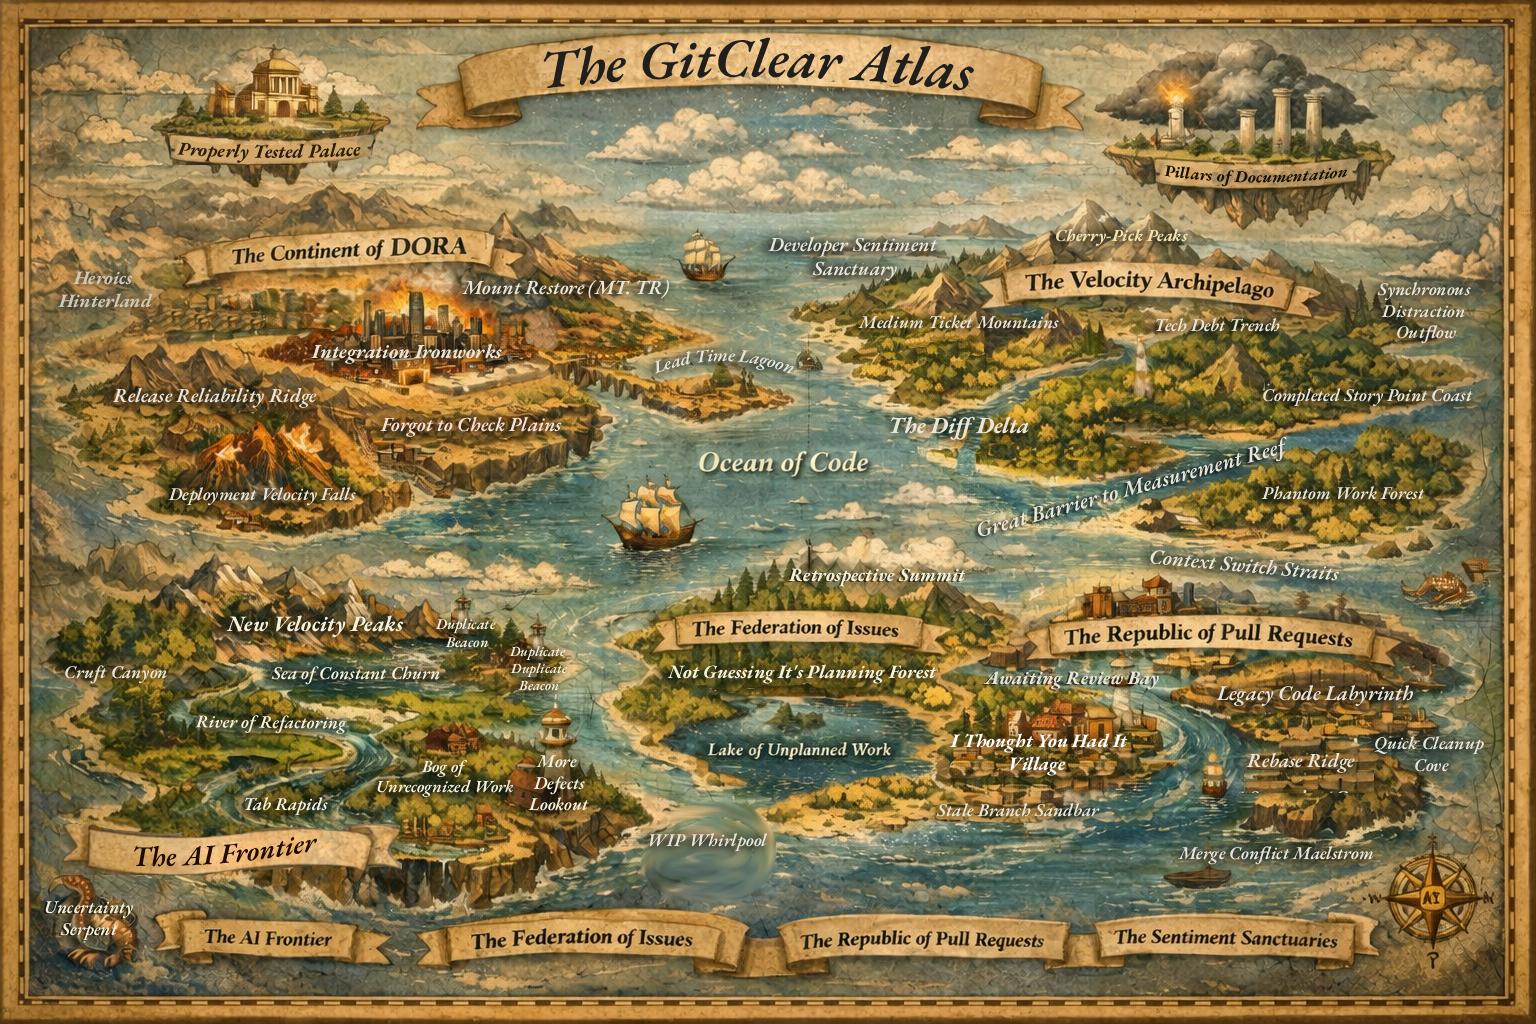
A wide world of analytics possibilities to explore
As you can see, these "locations" blend "the most-oft mentioned metrics" with "patterns" and "anti-patterns" of development we've observed during 5 years of building developer metrics.
If you're new to the Developer Analytics space, read on to learn more about the continents featured in The GitClear Atlas:
linkThe Continent of DORA
DORA is the Google-led project that has 10+ years of published reports, measuring how teams fare in Devops-related metrics like "Release frequency," "Issue cycle time," "Mean time to recovery," and "Deploy fail frequency." You can find most of these key DORA metrics on the DORA continent. You can also find "Forgot to Check Plains," because most of our customers end up forgetting to regularly check on their DORA stats after a few weeks, because the stats accumulate so much more slowly than "PR," "Issue," or "Velocity" stats.
linkThe AI Frontier
Here's one that you couldn't stop reading about, even if you badly wanted to, in 2026. GitClear has begun to assemble a page dedicated to listing the most data-backed AI Research papers we encounter that focus on measuring what sort of impact AI is having on developer throughput. The tl;dr of AI progress in 2026 is that "the correlation between 'greater velocity' and 'greater AI use'" is stronger than previously thought, but there are still a multitude of risks -- especially code duplication.
linkThe Federation of Issues
Most teams use an issue tracker like Jira to marry "desires of the product team" with "mandate of the executive team" and "bandwidth of the dev team." While most every team aspires to capture all of their developer work in issue tracker tickets, the reality is that doing so adds significant process overhead; thus, many startups and new companies will try to take shortcuts and work on projects that are not described in any Jira issue. This is the "Lake of Unplanned Work" and the "WIP Whirlpool." Teams with expert, attentive leadership aspire to periodically meet to retrospectively discuss what went "right" and "wrong" in their recent sprint.
linkThe Republic of Pull Requests
In theory, most companies want all developer work to begin life as a pull request (a collection of git commits), usually inspired by a Jira issue. However, in practice, there are many struggles to submitting all work via pull request. Those challenges range from "long awaiting review times" to "uncertainty about who is supposed to be reviewing a particular pull request." A well-run pull request process finds opportunities to clean up code adjacent to the work that was requested, all while ensuring at least 10-20% of the PR work is spent writing test code to confirm that future changes will not break the initial implementation. If the developer can find their way through the Legacy Code Labyrinth, they will succeed at advancing their team's agenda.
linkThe Velocity Archipelago
Separated from the other continents by "The Great Barrier to Measurement Reef," there is still negligible consensus among experts about "which metrics can be trusted to reflect that durable, high-quality code changes are being consistently produced." What makes this measurement so challenging is that teams always have the "fools gold" of classic git metrics like "Commit Count" and "Lines of Code Changed," tempting inexperienced managers to use these readily-available metrics as a proxy for progress. But since these classic developer metrics are incredibly easy to game, they lose all signal once the developers realize how they're being measured. Diff Delta has been evolving over more than 5 years as a method to establish a stable proxy for "how much durable code change is occurring in the team's repos over time?" By excluding 97% of changed lines and preserving the 3% that represent meaningful change, Diff Delta offers a means to answer practical questions like "Is this pull request going to take too long to review?" and "Are we consistently writing and updating our tests as we create features & resolve bugs?"
linkHigh Ideals
Finally, "Properly Tested Palace" and "Pillars of Documentation" float above the fray as the goals that every team strives toward, and very few realize. However, by choosing a consistent set of developer metrics, and pairing it with developer sentiment measurement (to track developer sentiment/happiness), well-managed teams can progress toward these lofty visions.