GitClear offers AI usage metrics for all the largest AI coding providers. We add new providers whenever a new customer subscribes using an AI Provider that is not yet integrated. As of Q2 2026, GitClear offers per-developer, per-team and per-resource (e.g., organization/repo) AI usage stats for the following AI providers:
GitHub Copilot
Cursor IDE
Anthropic/Claude Code: Anthropic offers a couple different APIs for gathering data, you can use platform.claude.ai or claude.ai with an Enterprise Teams plan
Gemini Code Assist (beta): The IDE extension that Google offers for Gemini integrations
Augment Code
Data from all AI providers is normalized into a data model that lets managers understand the cumulative amount of AI use that is happening each week, and how that is evolving over time.
Note that AI Usage Stats are only half of the picture that GitClear offers to understand how AI is impacting your team. The other half is the AI Cohort Report, which you can read more about here.
linkViewing AI Usage Stats
Under the "AI Impact" tab and "AI Usage" sub-tab, you'll find a variety of charts showing the extent to which the team has utilized LLMs during the selected time range.
linkComposite AI Use
Think of "Composite AI Use" as "the Diff Delta of AI use." The same way that Diff Delta captures how much durable code change is occurring in your repos over time, Composite AI Use captures how big of an impact that your team's AI use is having on your repos over time:
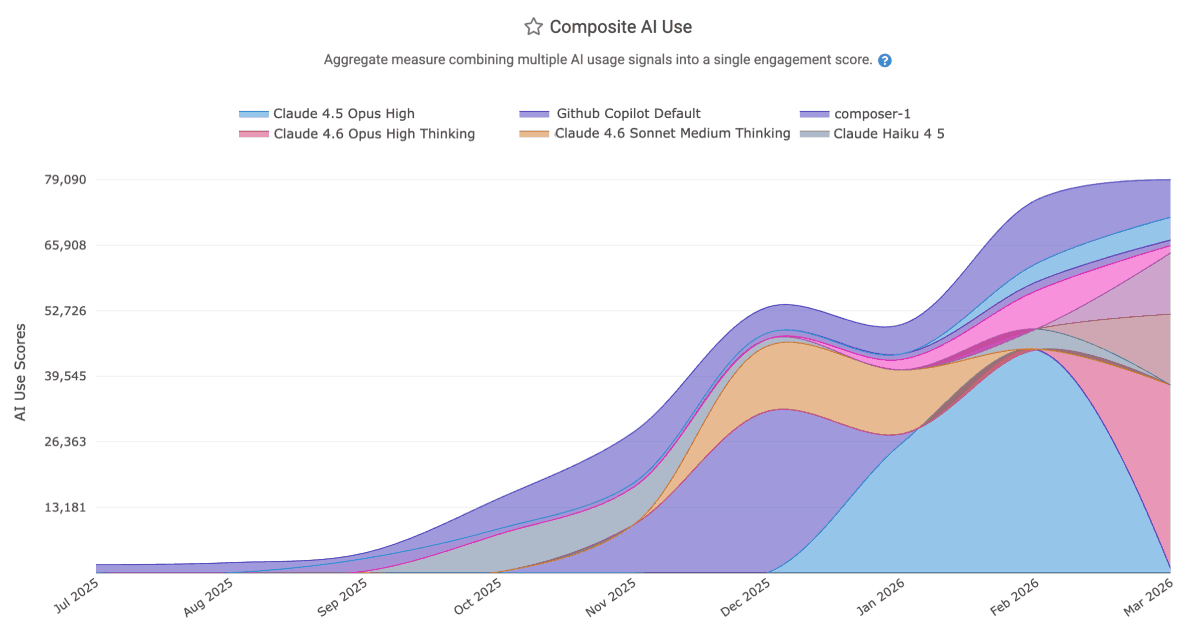 |
Also similar to Diff Delta, "Composite AI Use" blends together many different usage signals to produce a consistent indicator which conveys how much of the team's work is AI-powered. Among 10 proprietary factors, some of the heavily weighted signals include "count of lines changed," "percent of accepted lines that go on to be deployed," and "cost."
In addition to grouping by LLM model, it can be grouped by AI provider, repo, and more.
linkPrompt Acceptance Rate and Tab Acceptance Rate per language model
When a developer explicitly prompts the AI with a question, what percentage of those interactions result in the developer utilizing the response they were given? What about when the AI makes a suggestion by showing lightened text that can be inserted by pressing tab? GitClear measures both, on a per-model (e.g., Claude Sonnet vs ChatGPT vs Gemini) basis:
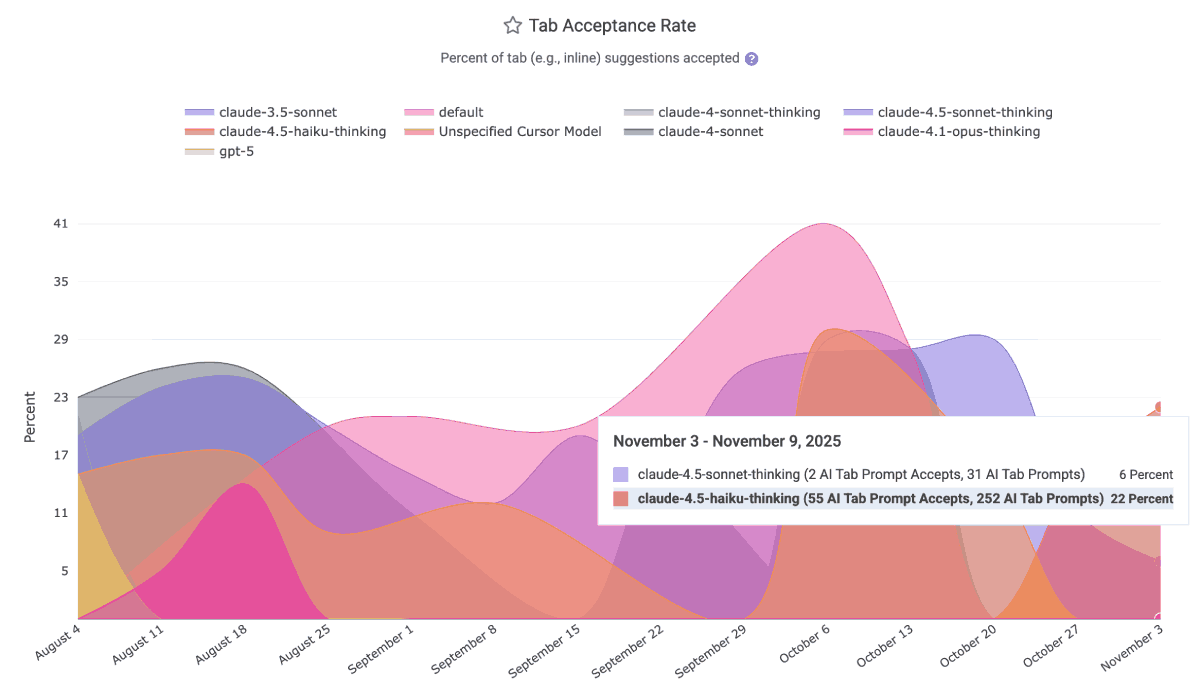
This data is ideal for helping to disseminate within a team which LLMs have been producing the most applicable results over the past month. It is available via the Reporting API as ai_prompt_acceptance_percent and ai_tab_acceptance_percent. The per-model data is available to all AI providers except the default GitHub Copilot business tier, which labels all LLM acceptances as "Default Model" as of Q4 2025.
As of Q4 2025 Github Copilot does not return per-language stats, but Cursor and Claude Code do. |
For users of Github Copilot, it is still possible to see the overall counts for how any AI usage stat is trending over time; it just isn't possible to give the full richness of model comparison that is possible from AI APIs that return this data.
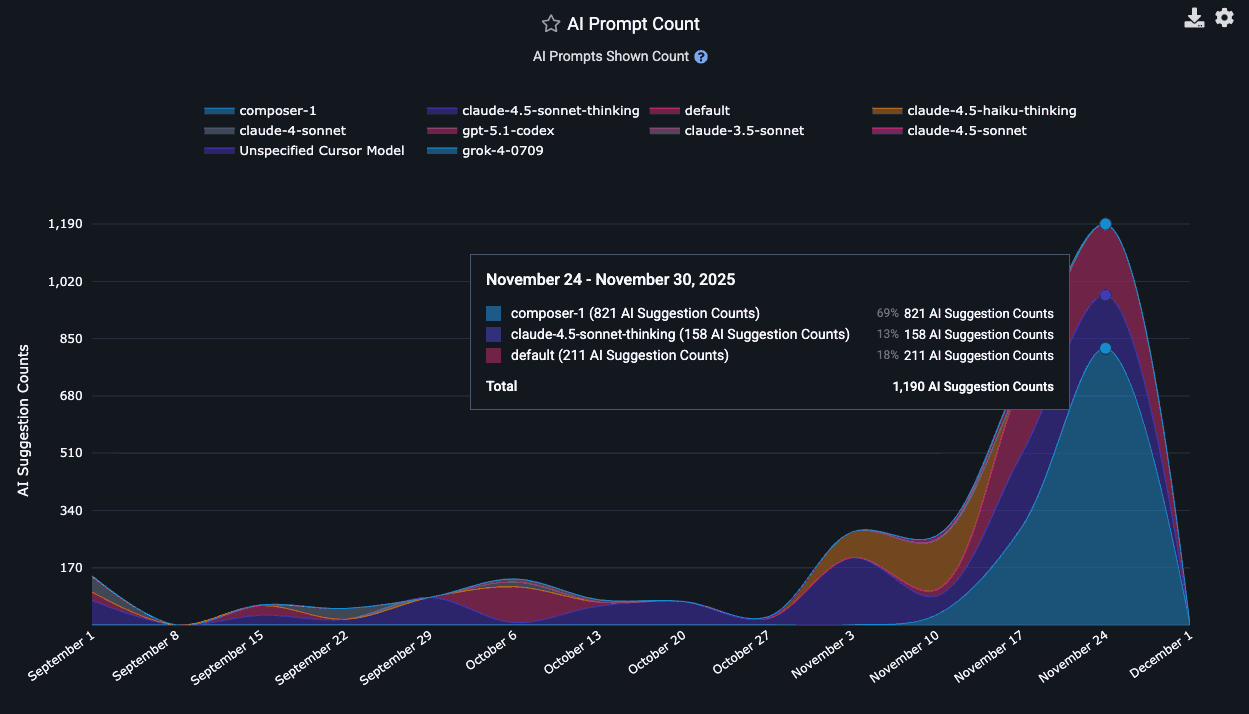
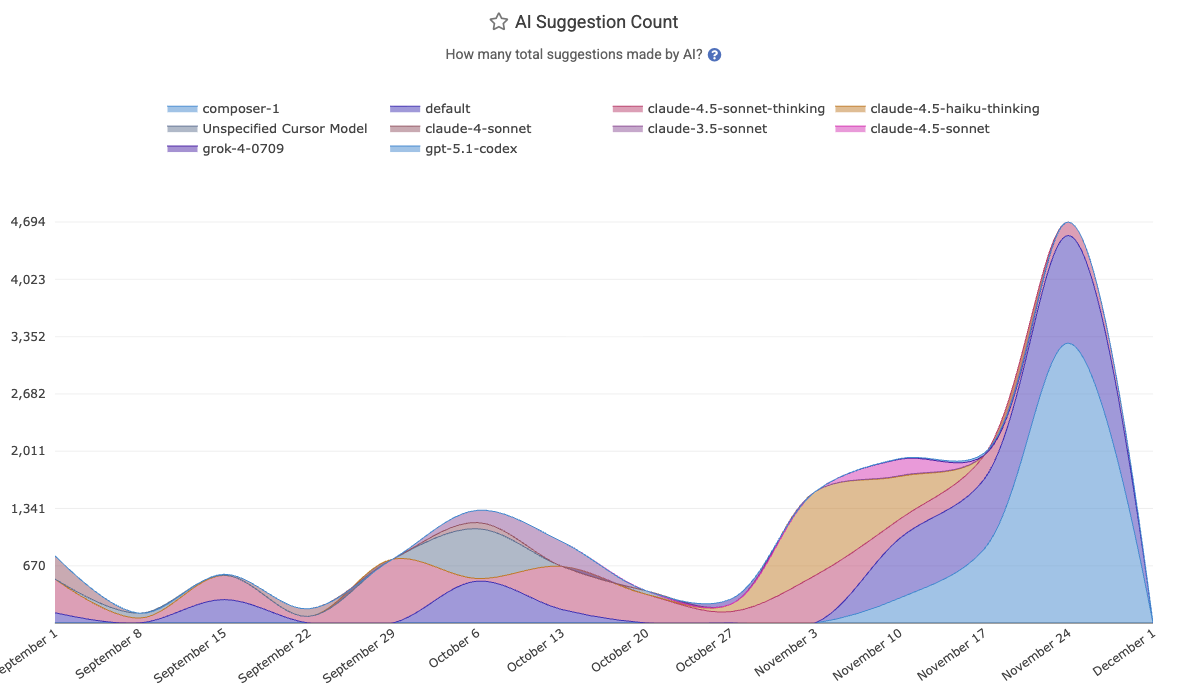
linkPrompt Suggestion Count and Tab Suggestion Count per language model
Calculating the number of suggestions per AI provider requires applying judgement for what, exactly, counts as a "suggestion."
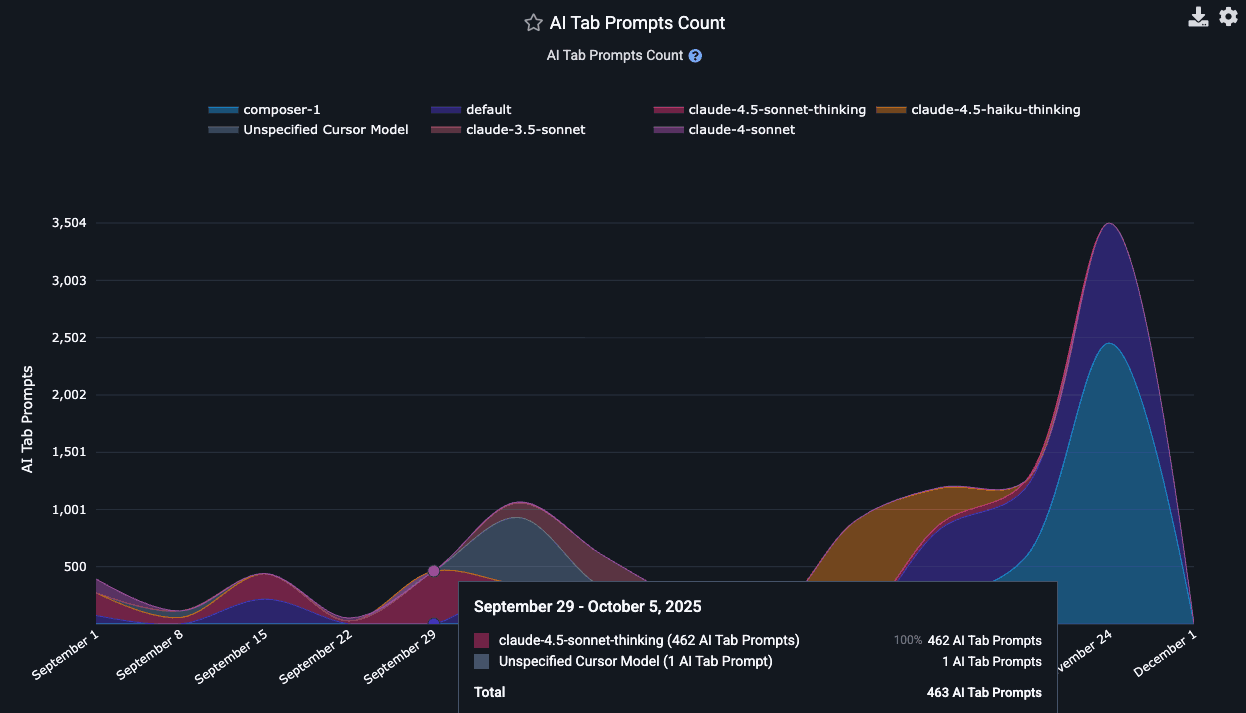
If you don't want to get lost in the weeds, simply think about "Tab Suggestion Count" as "How many times did the AI suggest code the developer could press 'tab' to insert as code?"
Think about "Prompt Suggestion Count" as "How many times did the AI make suggestions to the developer, outside its suggestions on how to finish the line the developer is typing?"
In the Reports API, the count of ad hoc suggestions the AI made to the developer as they were writing code is known as tab_prompt_count. The sum of suggestions made to the developer in all other contexts is approximated as non_tab_prompt_count. These numbers can be multiplied by the acceptance rate to get the number of accepted suggestions for "tabs" and "prompts."
In terms of specific technical details, Copilot derives the "Prompt Suggestion Count" by summing total_code_suggestions per-editor, per-model. Cursor gets it by summing together "chat requests," "composer requests," "agent requests," "applied suggestions," "accepted suggestions," and "rejected suggestions" to get a grand total of requests (=> suggestions) and opportunities the user had to accept a suggestion.
linkAI Lines Added and AI Lines Deleted
One of the most oft-reported drawbacks of AI is its propensity to duplicate code. That's what makes it useful to keep an eye on how actual line changes are playing out among your teammates, on the "AI Impact & Usage Stats" tab
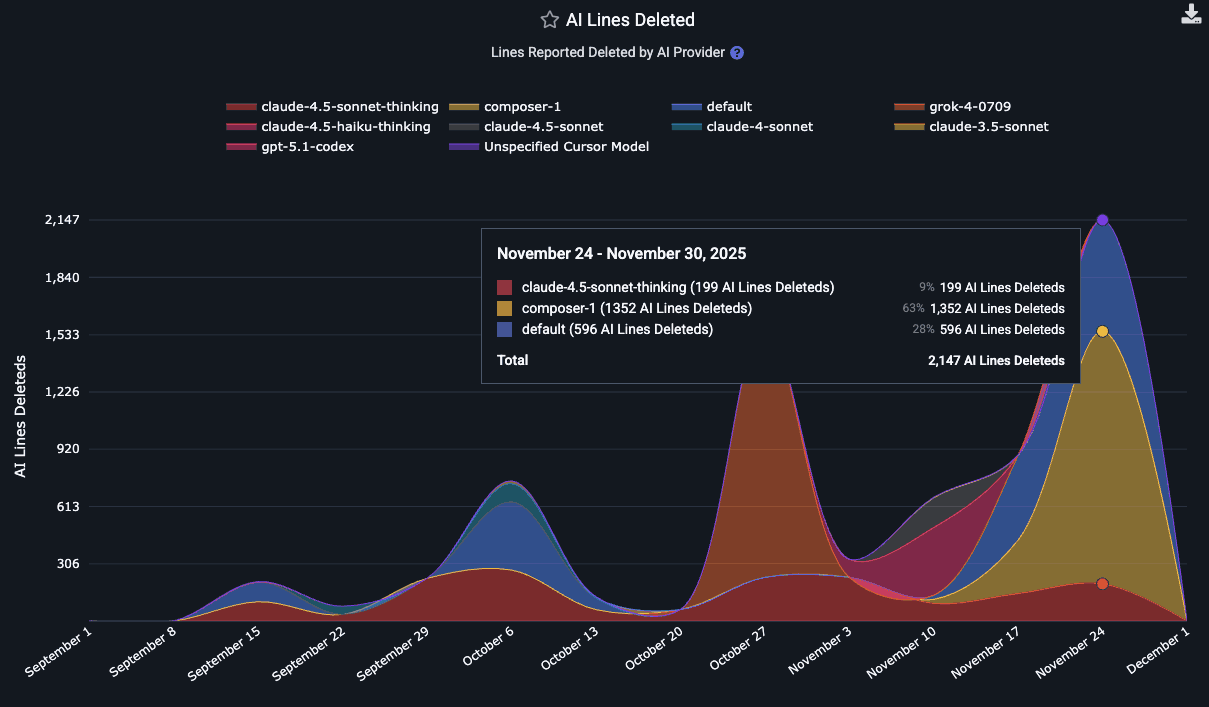
How many lines have been deleted by each of the LLMs used by the team lately?
Typically, the "Lines added" are around 5x the "Lines deleted" for LLMs of the mid-2020s. Some day hopefully they will better figure out how to effectively recommend code deletion opportunities, since it is such a key to long-term repo health.
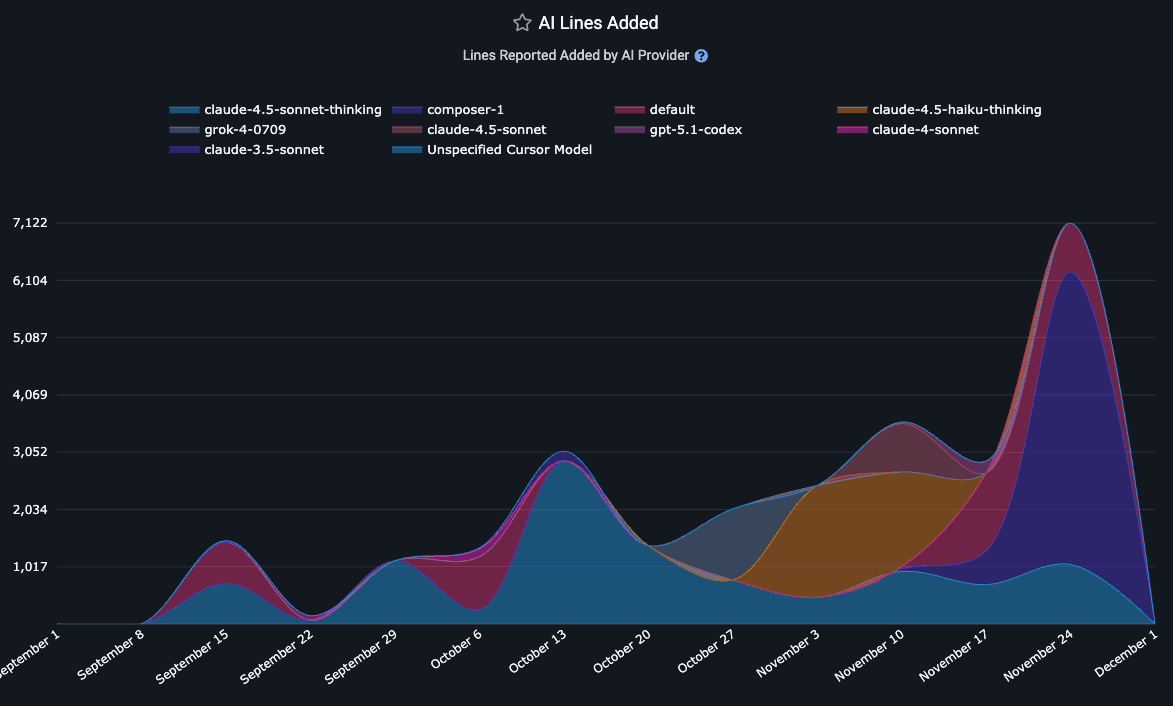
These segments are available in the Reports API as ai_lines_added_count and ai_lines_deleted_count.
Note that there is no guarantee that the developer will go on to commit the lines that they accepted from an AI. In fact, as often as not, developers will accept a block of code in order to get it into a state where they can start picking it apart -- by deleting large swaths that are non-applicable, or by making large modifications to the initially inserted lines.
linkEngaged AI Provider Accounts and Inactive AI Developers
How many AI providers are being used by developers on the team? These metrics help understand the adoption trend for AI across the team. The Reports API segments for these are ai_engaged_committer_count and ai_inactive_committer_count
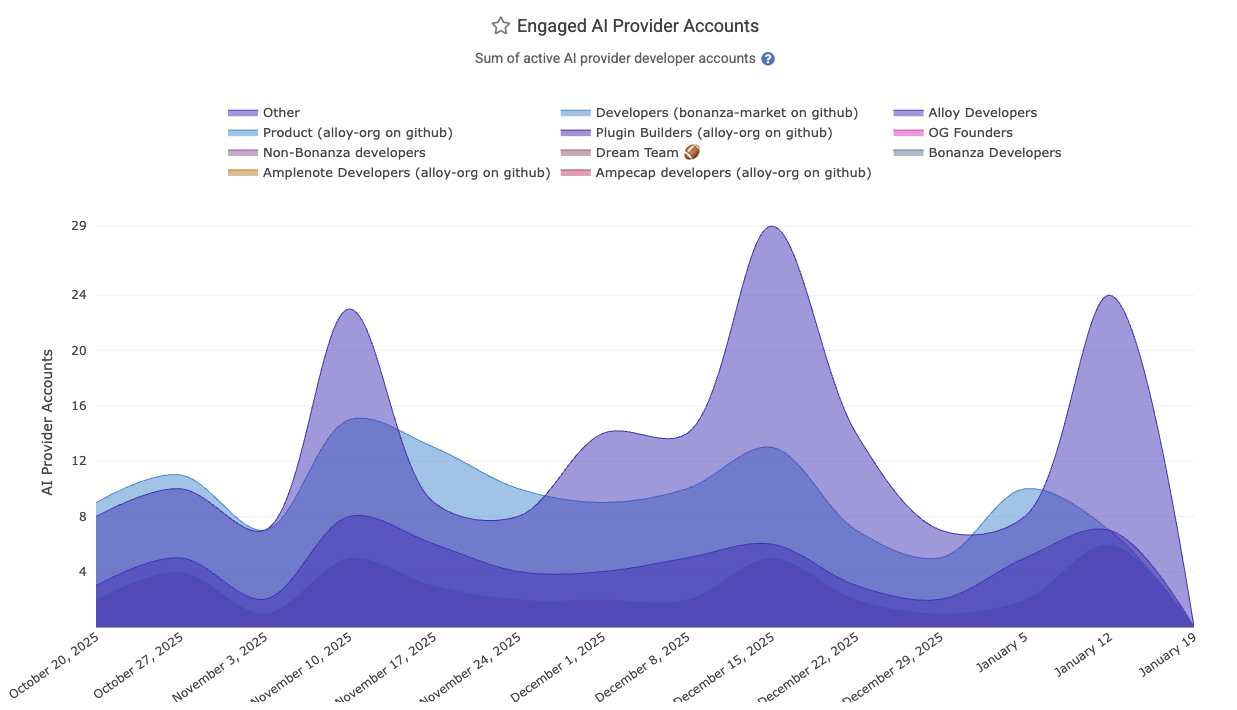
The calculation of "Engaged" committers varies by AI provider. The overall count of "Engaged AI Provider Accounts" sums the number of accounts being used across LLMs. If a single developer is using Copilot AND Cursor AND Claude Code, they would account for 3 "Engaged AI Provider Accounts," so the per-team count of Engaged AI Providers can be higher than the count of team members, if you're among the teams that use multiple LLM providers.
Since Github Copilot does not, by default, report the total number of active users per language (all of their per-language data reports "Engaged" users), we periodically query Github to assess when each developer was last active with AI. For all time after the customer has signed up, this allows us to derive a maximally accurate count of the number of developers that are participating in Copilot use in a given day or week. For historical data, we fall back to what Github reports as the "Engaged" user count, which they differentiate from "Active Users" by explaining in their documentation "A stricter version of 'Active Users,' this tracks the number of employees who use a tool multiple days per month. The exact number should depend on your company’s definition of what an engaged user should be. A growing number of "Engaged" indicates that users are moving beyond initial experimentation and are beginning to form a habit."
The derivation of "Engaged AI Developers" for Cursor is more simple, as they report all stats on a per-developer basis, so we can simply evaluate over the history of AI usage how many developers were active Cursor users per-day or per-week.
To calculate "Inactive AI users," we subtract the count of seated committers in a given time period by the number of users that were deemed to be "Engaged AI users"
linkAI Usage Cost
When the AI API reports a cost ascribed to the developer's requests, it will be returned as ai_cost_cents via API. This does not include the base subscription cost that typically makes up the bulk of the monthly invoice for business customers of Copilot, Cursor and Claude, which is why it is not included among the default stats presented on the AI Usage tab.
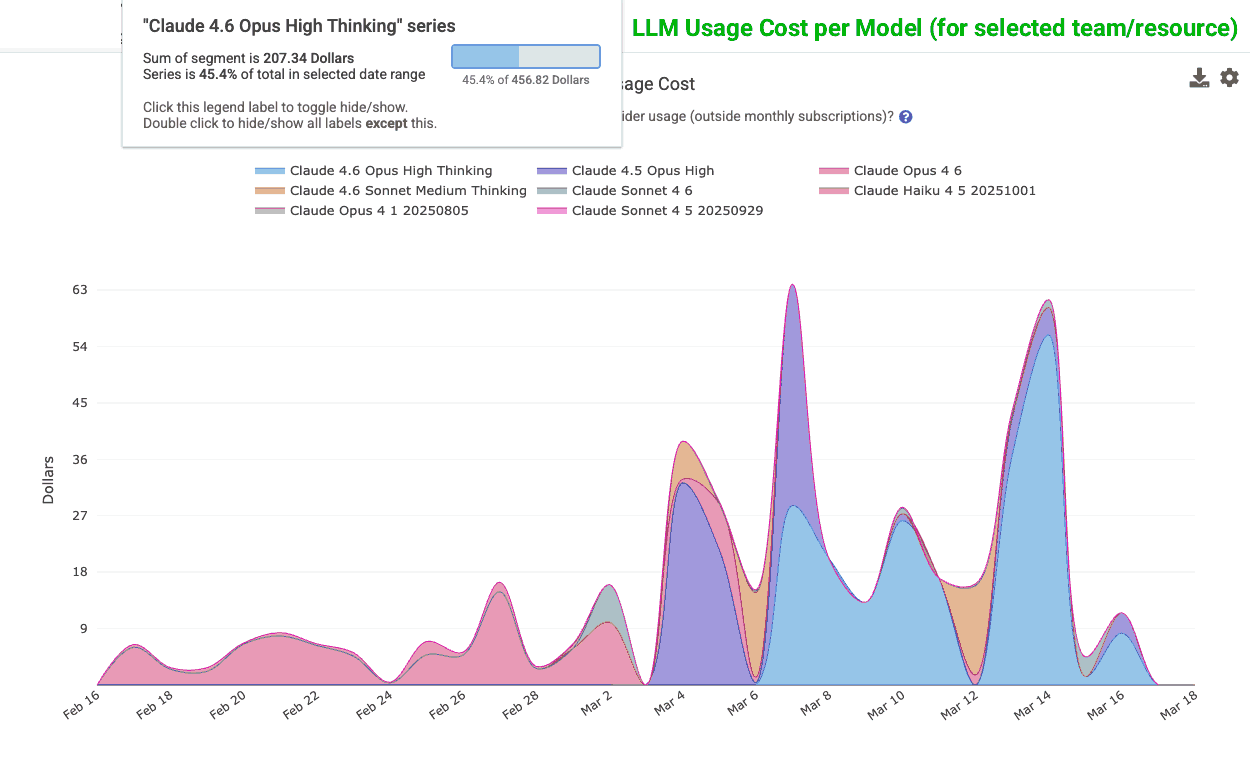
How much is each team spending on AI - per model? Per AI provider? Per Developer?
The bean counters can email support@gitclear.com if they'd like to enable notifications when the measured costs exceed a threshold. We have yet to enable this for general access, supposing the the individual AI providers' dashboards offer this functionality natively. Though GitClear's ability to aggregate all of a team's AI provider costs into a single chart is uniquely useful, vs. looking up costs provider-by-provider.
linkAll Suggestions Count
The all_suggestion_count aggregates all of the request & suggestion metrics available per provider. It can be thought of as the "global barometer for how much AI use is occurring"? It combines all tab and prompted suggestions.
This is the best overall gauge of the extent to which a team has actively applied AI to advance their development.
linkUnderstanding AI Use per Developer
Frequent questions that managers seek deeper understanding on are "which of the developers from my team have been using AI regularly?" and "which specific models are my most prolific developers using?" GitClear can allow a manager to answer either question.
linkAI Use by Developer
For AI providers that return per-developer stats, you can open a chart's settings by hovering to click the "Gear" icon, then choose an "Aggregate by" value of "Committer":
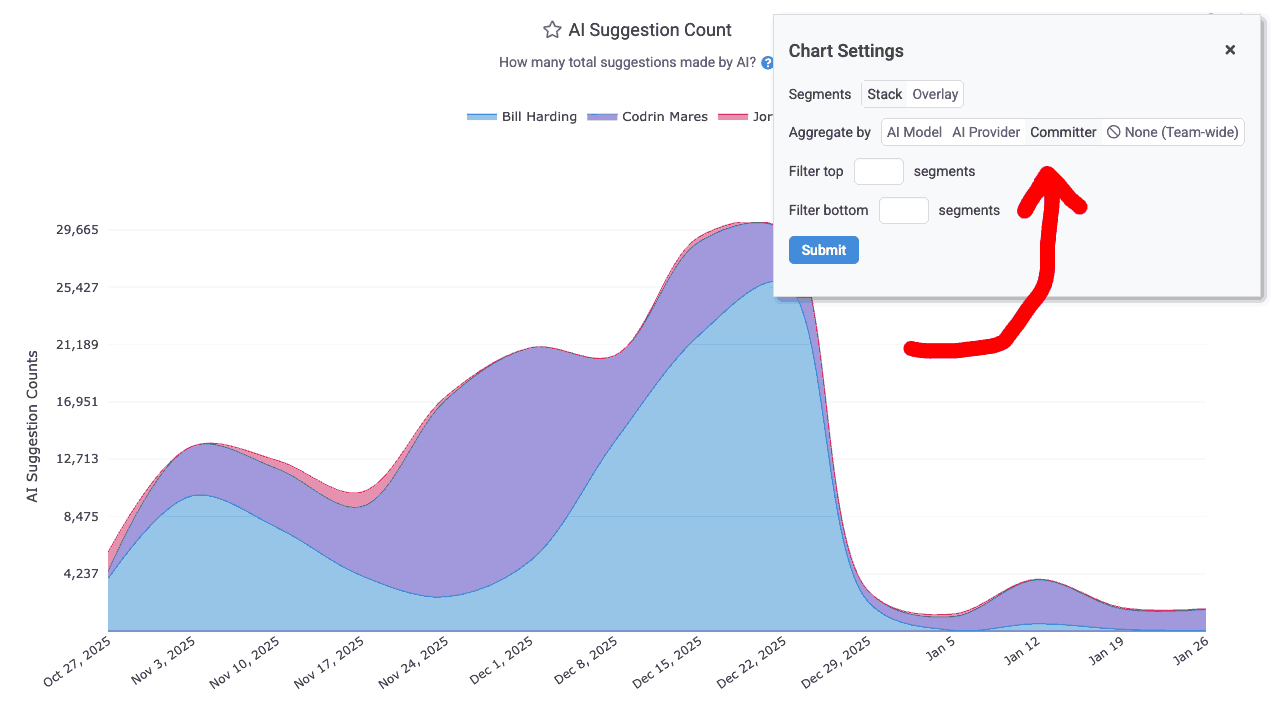
Aggregating AI use by developer on the AI Usage page
After aggregating by committer, you can get more details about the developer's overall AI use by hovering on their segment label (i.e., their name).
linkPreferred Models for a Developer
To review the preferred LLM models for a committer, use the "Committer Filter" to pick a developer when you're visiting the "AI Usage" tab. This will refine your data to show only the AI stats that have been attributed to a single developer. Once you've filtered by developer, all of the usual stats from the page ("Suggestion count," "Usage by model," "Usage by AI provider," "Acceptance rate," etc) will be shown for the specific developer you selected.
linkAnalyzing a Developer's AI Cohort
Typically, the AI Cohorts report is used to compare how different levels of AI usage translate to measurable team output. However, it's also possible to view the Cohort report, filtered by a single developer. This will filter the selected team + resource such that you see only the AI Cohort to which the developer belonged on a given week:
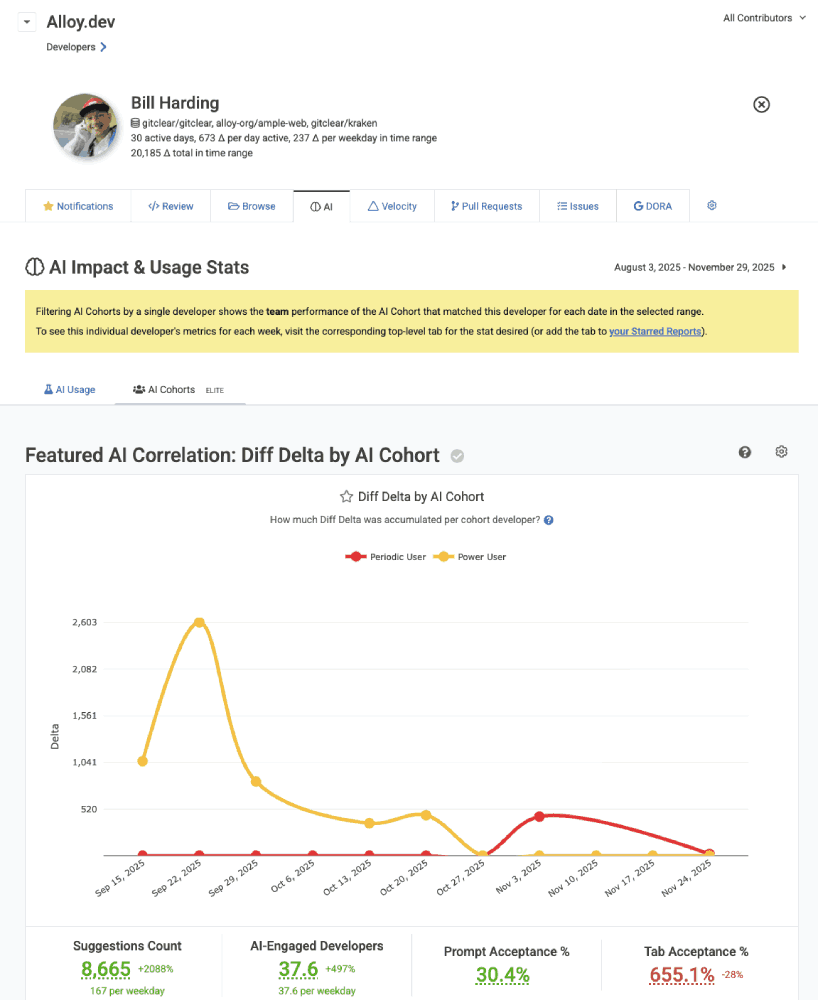
Filtering AI Cohort by a single developer
This allows you to see which Cohort groups a developer has qualified for on a week-by-week basis. Since GitClear assigns a developer's AI Cohort for the previous week at the beginning of a new week (after we have data showing how much AI use was experienced during a given 7-day window), it is expected that a developer's AI Cohort will fluctuate from week-to-week, depending on the extent to which their assigned tasks compel them to utilize available AI tooling.
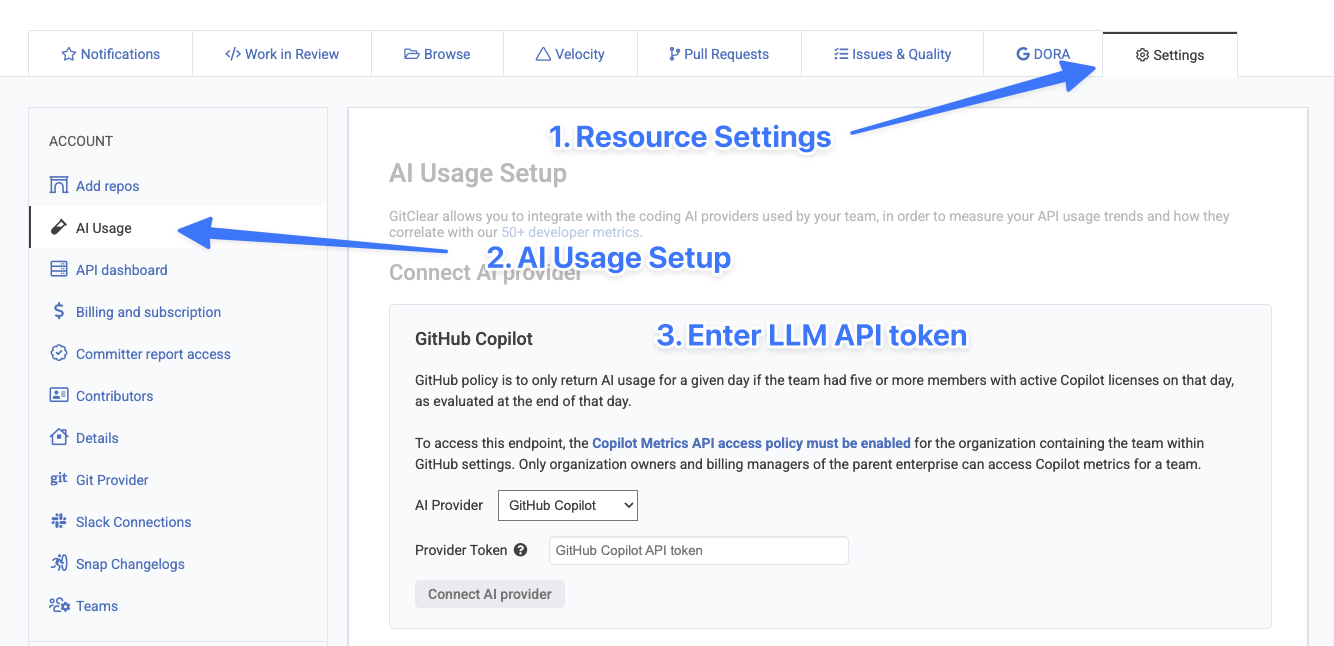
linkConnecting to an AI Provider
To connect to an AI provider, visit the "Settings" tab for your resource and choose "AI Usage"
The full help documentation for connecting to your preferred AI API is available here.