GitClear offers a number of sprint stats under the "Issues" tab and "Sprint Stats" sub-tab. These stats are available to any user who has connected to a Jira instance with sprint data.
linkSetting up Sprint Tracking
There are two essential steps to retrieving sprint stats for your team. The first is to connect your entity to Jira, which you've probably already completed during the GitClear setup process. The other is to specify which Sprint Board corresponds to which team.
There are two options to associate teams with a project board:
Use the Teams API to specify project_board_id for each team
Visit "Settings" then "Teams," and choose the project board from the "Issue Tracker Board" settings, which will be available when you have connected to a Jira instance with available project boards
If you don't specify a project board for your team, GitClear will attempt to assign a board automatically, based on which issues the team has worked on.
linkSprint Stats Overview
Below, find the various graphs that GitClear can provide for teams that use Sprints and Story Points to make sense of their planning and execution performance.
"Sprint Stats" are available for Elite subscribers under the "Issues & Quality tab"
linkSprint Velocity (Planning Accuracy)
What percentage of a team's Story Point commitment has been completed per-team over time?
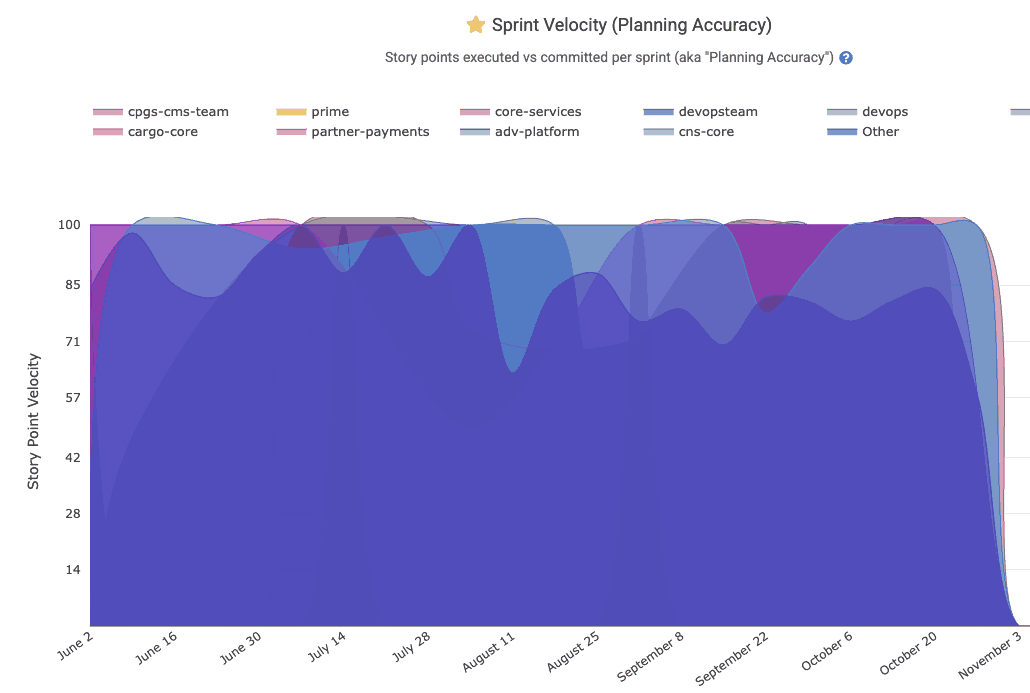
When a team's Sprint Velocity falls below 90%, it is often worth a conversation about whether the team should adjust its planning to set more attainable goals.
linkUnplanned Story Points
What percentage of Story Points completed during a sprint were not in the sprint when it began?
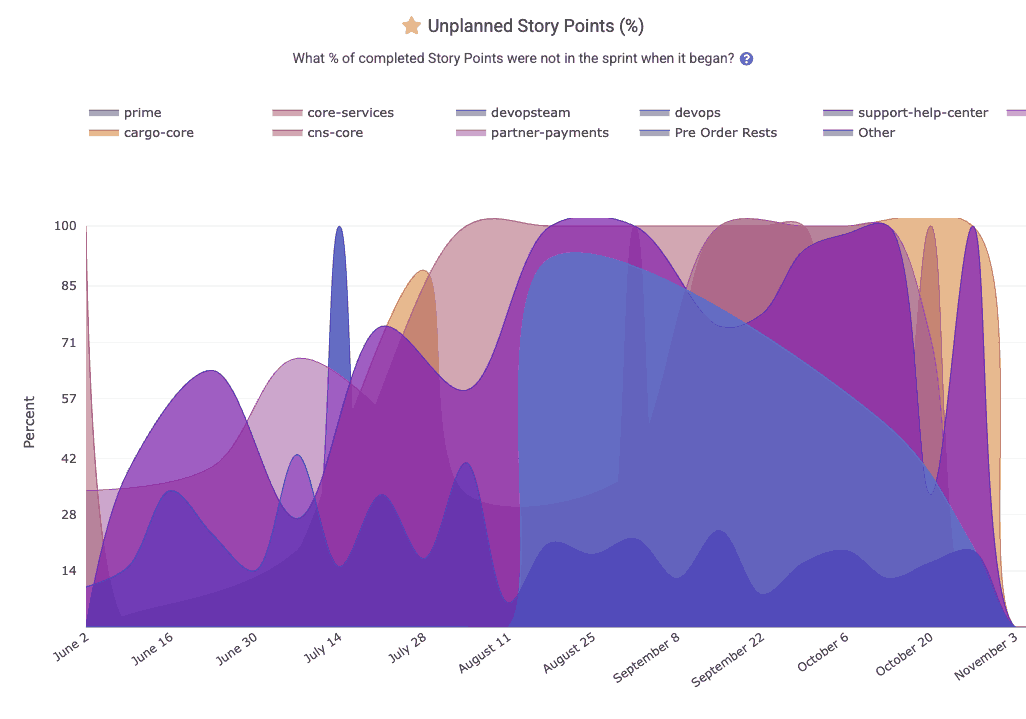
For the sake of VPs and executives that want to better grasp which teams have ended up with a large percentage of their Sprint work coming from tasks that were not scheduled at the beginning of the sprint.
linkStory Points Bug Percent
What percentage of a team's Story Points come from issues that were designated as "Bugs"?
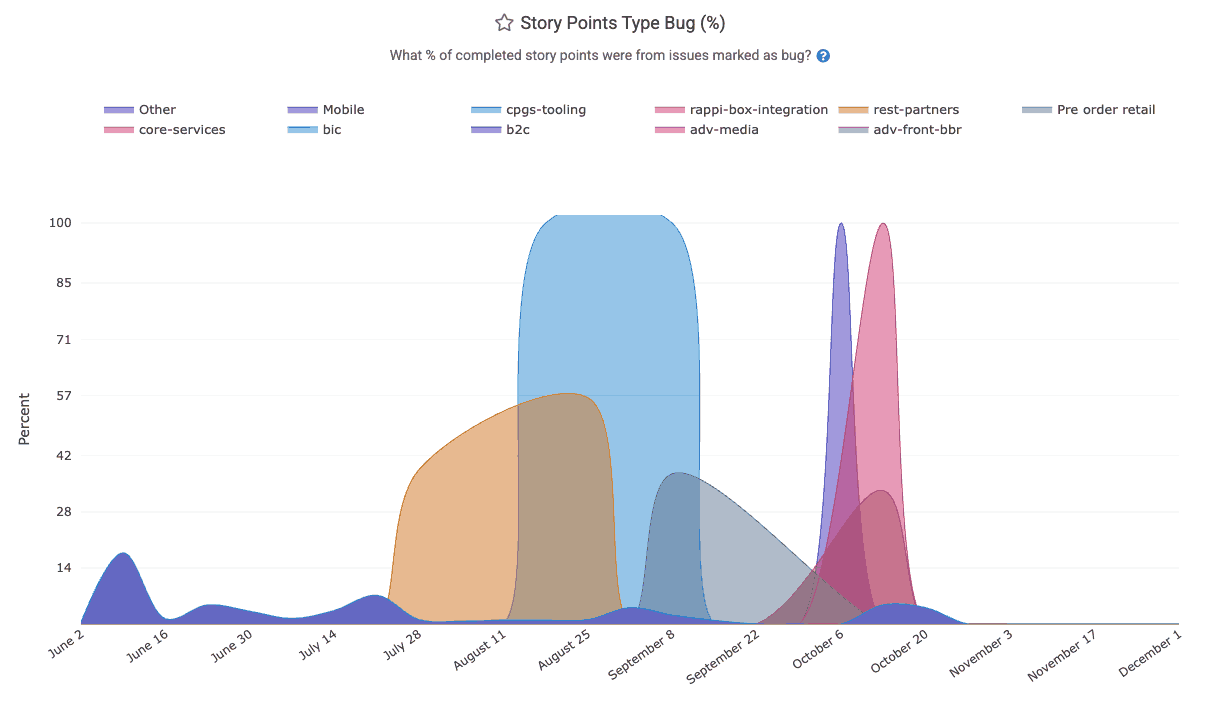
When a team consistently finds that 20% or more of its issues are being spent on bugfixing, it can be worthwhile to re-assess quality control practices.
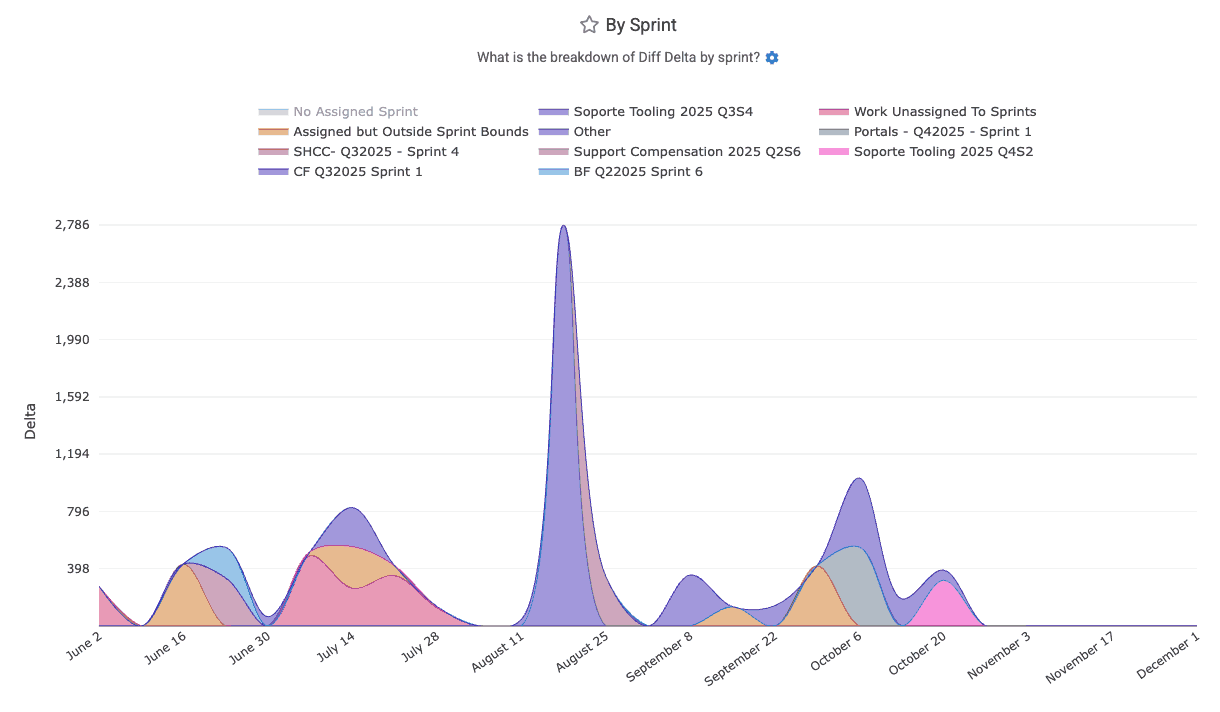
linkDiff Delta by Sprint
How much work has been ascribed to recent sprints? The "By Sprint" graph reveals the answers.
linkStory Points Resolved by Sprint
How many Story Points were resolved by various teams' sprints?
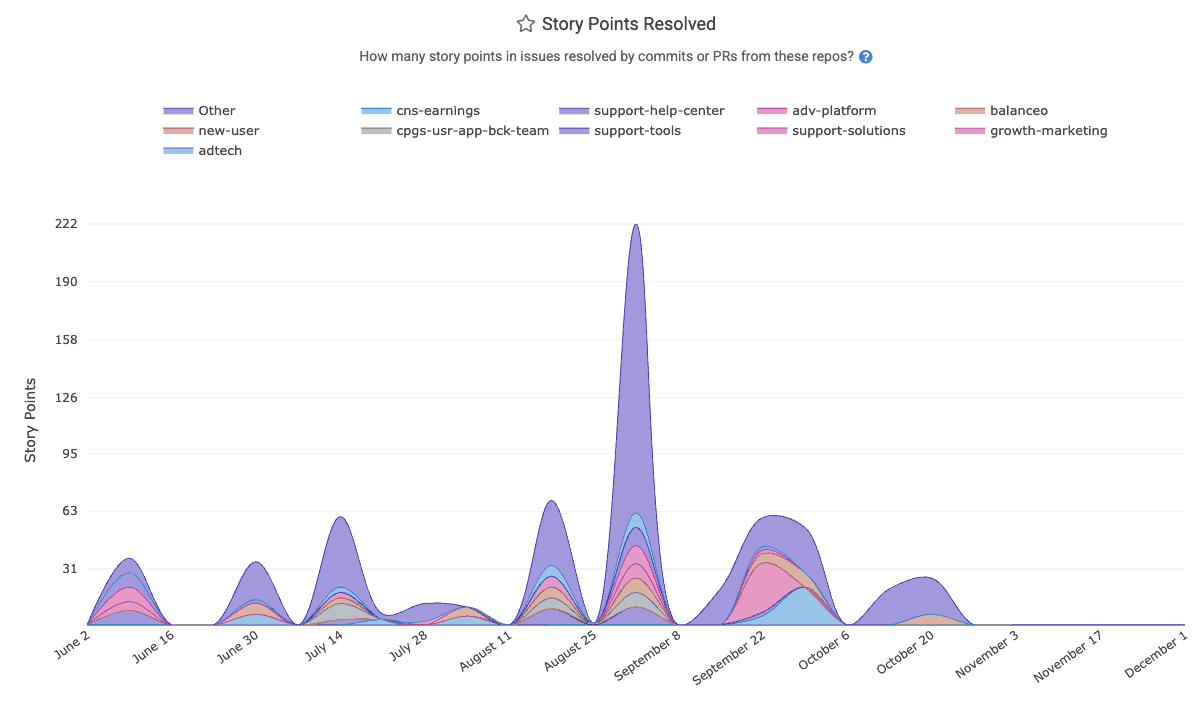
Since most teams run sprints on 2-week intervals, the graph will tend to spike for each week where a sprint completed.
linkSprint Story Points Committed
How large of a load did each team commit to at the beginning of its sprint?
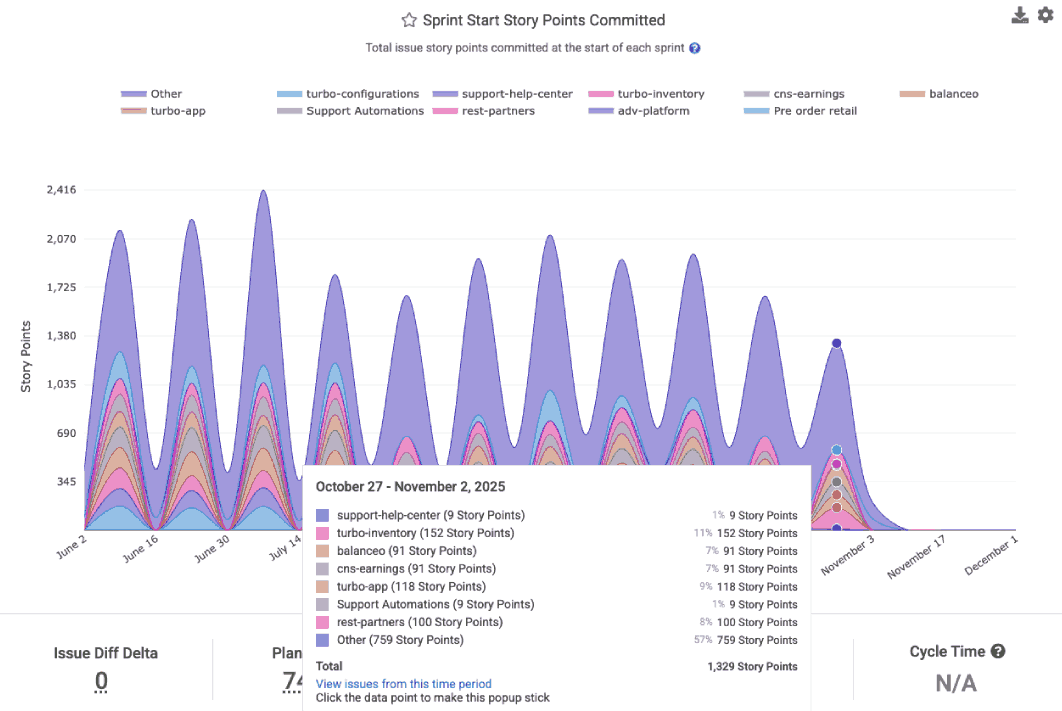
This offers a means to evaluate how large a team's sprint goals have been over time.
linkStory Points Completed per Sprint
How many Story Points has each team completed per sprint?
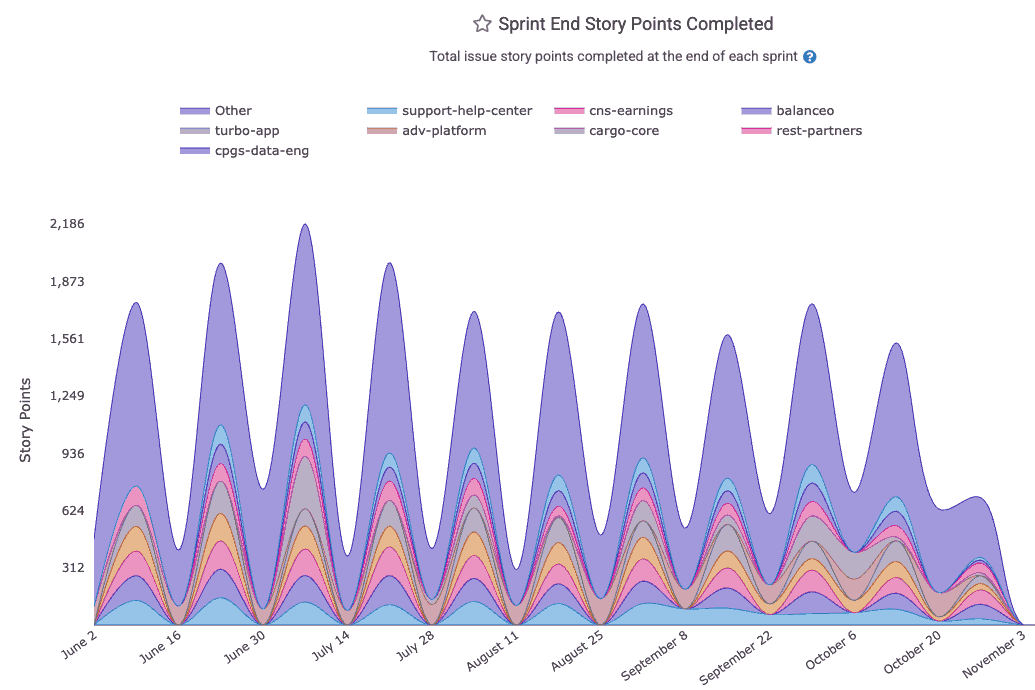
This graph is typically compared to the number of Story Points the team committed to, as a means of understanding how a team has fared in terms of completing its goals.
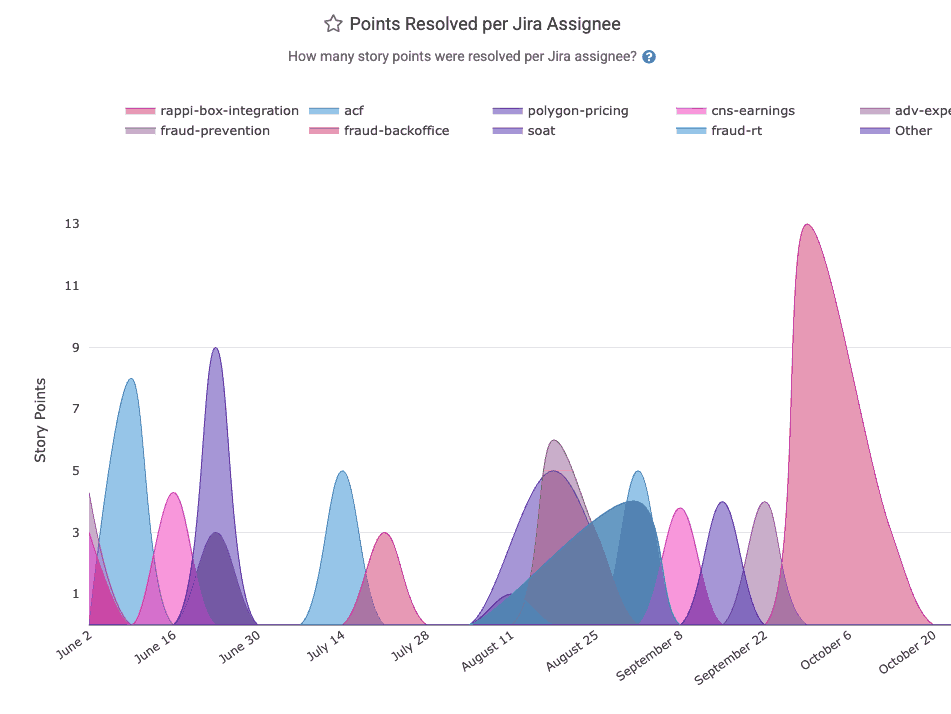
linkStory Points per Assignee
Similar to "Story Points Completed per Developer," the Story Points per Assignee graph differs in that it shows how many Story Points were completed per Jira assignee. This can provide more precise data when developers do not consistent mention which issue they are working on in their commit or pull request (which is prerequisite to calculating "Story Points Completed per Developer")