Along with AI Usage stats and AI Cohort stats, GitClear also offers a tab dedicated to seeing the raw percentage difference between a team's "AI users" and "non-AI users" over a given time interval.
The AI ROI tab can be found for Elite subscribers or Plus Trials under "AI Impact" => "AI ROI":
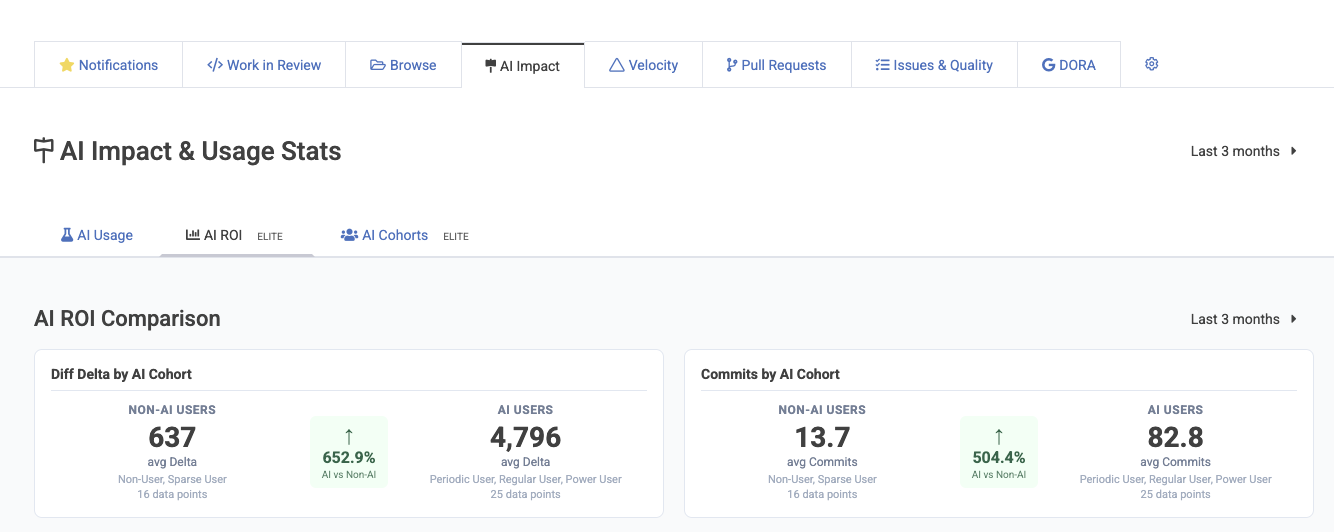
linkROI Comparative Stats
GitClear's charts compare values of "AI using-developers" and "non-AI using developers" on a weekly basis.
linkVelocity stats
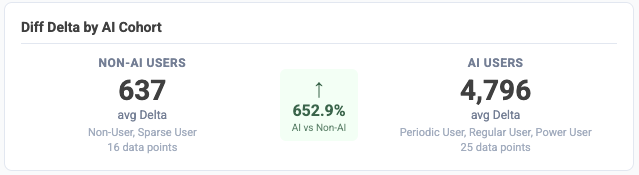
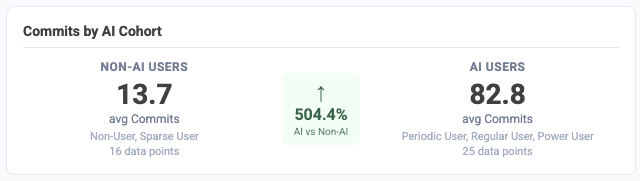
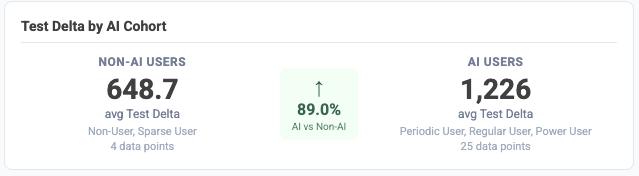
The first stats offered compare the baseline velocity metrics of developers who are active with AI vs not:
Diff Delta | Commit Count |
 |  |
linkQuality stats
Other comparison boxes on the page allow assessing how a team's code quality has improved or suffered with AI adoption:
Churn Lines | Test Work |
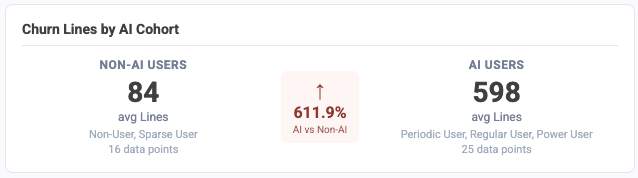 |  |
Churn lines are almost always going to be higher, but hopefully not as much higher as they are with our baseline repo shown here? There are stats that compare code duplication (a signature GitClear tracking metric) and "Teammate Review Time," aka, "how much review time is being driven by AI use?"
Copy/Paste (Duplication) | Teammate Review Time |
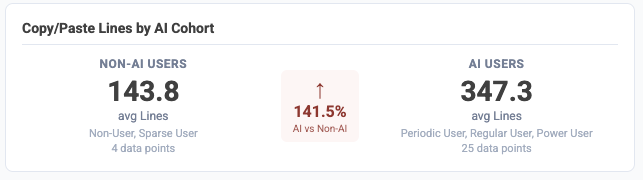 | 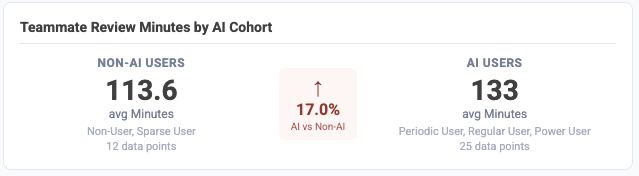 |
These are more code quality metrics that tend to get worse with AI use, but managers should strive to keep the delta between "AI" and "non-AI" users at less than 50%.
linkIssue & PR Stats
AI stats also extend to the volume of Story Points resolved and the count of PRs being opened, among other metrics available.
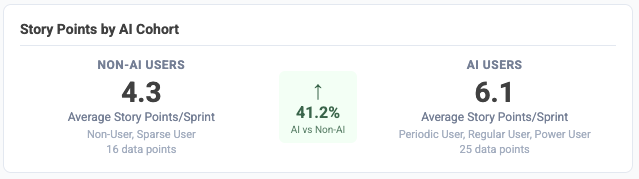
The pull request stats available are expanding with every passing month - drop us a line at hello@gitclear.com if there are PR metrics you'd like to see compared with AI that are not yet present among your AI ROI tab.