Following up on our 2023 Google DORA Summary, here are the best insights from arguably the best-produced research that is published annually.

10 years of setting benchmarks that teams rely on
Following were the distilled takeaways, by page. Click into a link with an image to see a screenshot of the page.
linkExecutive summary
DORA has been investigating the capabilities, practices, and measures of high-performing technology-driven teams and organizations for over a decade. This is our tenth DORA report. We have heard from more than 39,000 professionals working at organizations of every size and across many different
industries globally. Thank you for joining us along this journey and being an
important part of the research!
DORA collects data through an annual, worldwide survey of professionals working in technical and adjacent roles. The survey includes questions related to ways of working and accomplishments that are relevant across an organization and to the people working in that organization.
DORA uses rigorous statistical evaluation methodology to understand the relationships between these factors and how they each contribute to the success of teams and organizations.
This year, we augmented our survey with in-depth interviews of professionals as a way to get deeper insights, triangulate, and provide additional context for our findings. See the Methodology chapter for more details.
linkFindings by page
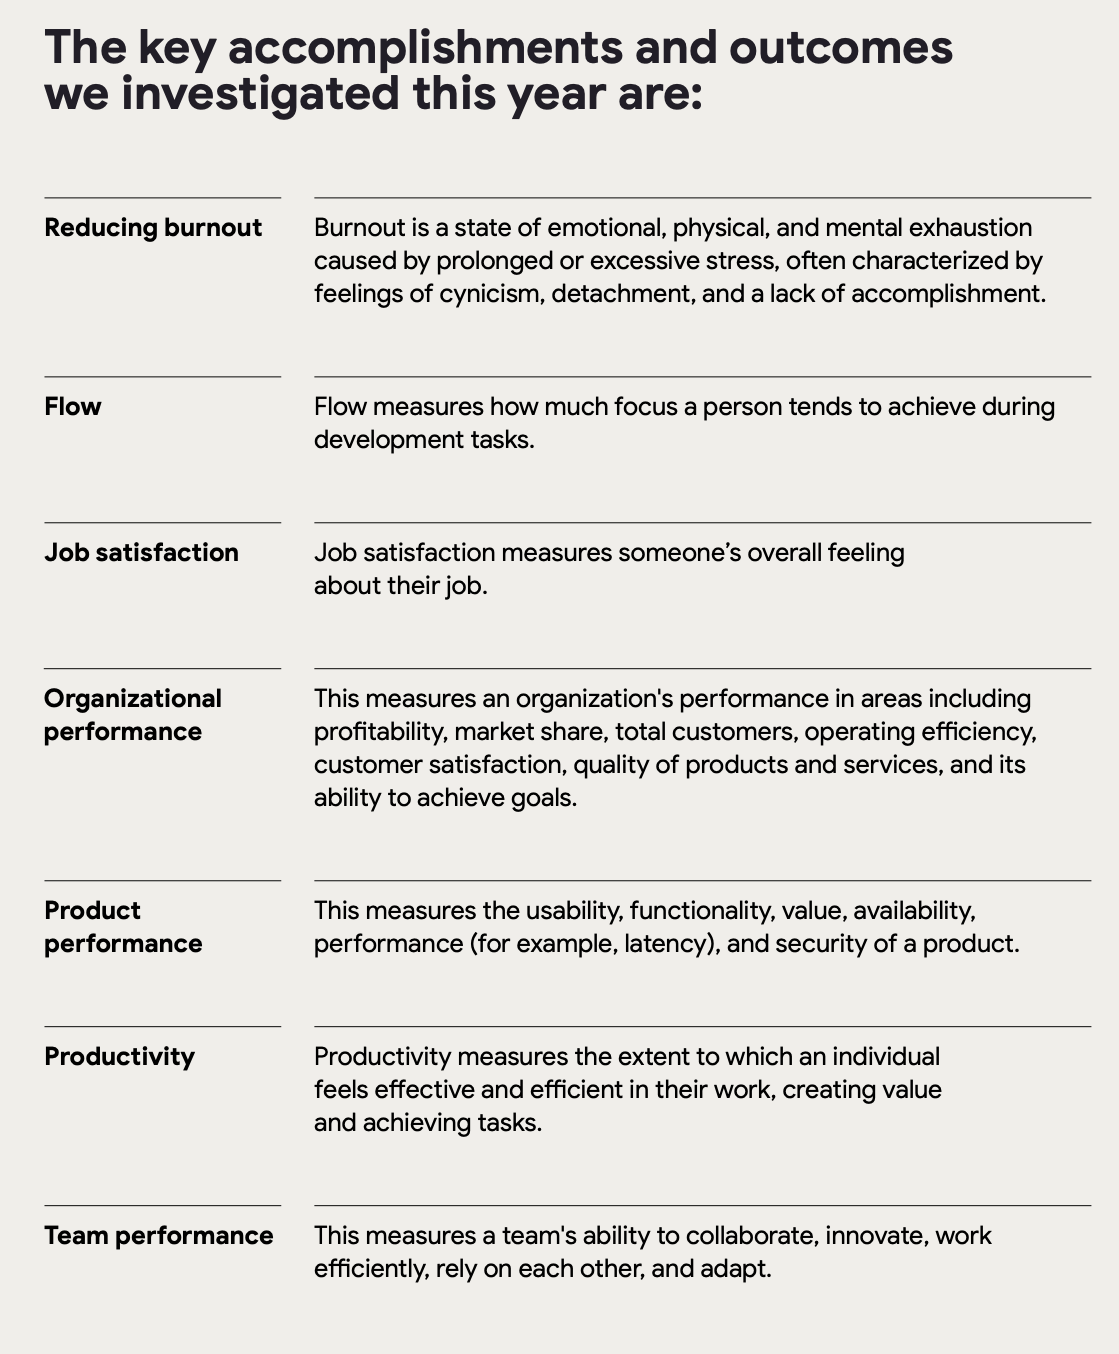
AI adoption benefits:
Flow
Productivity
Job satisfaction
Code quality
Internal documentation
Review processes
Team performance
Organizational performance
"We have observed reductions to software delivery performance, and the effect on product performance is uncertain."
"Individuals are reporting a decrease in the amount of time they spend doing valuable work as AI adoption increases."
AI adoption increases as trust in AI increases
User-centricity drives performance
Transformational leadership matters
Stable priorities boost productivity and well-being
Platform engineering can boost productivity
Cloud enables infrastructure flexibility
High-levels of software delivery performance are achievable
linkSection: Software Delivery Performance
Percentage of correlation unspecified
Quote: "To test this theory, we added another question this year about the rework rate for an application: "For the primary application or service you work on, approximately how many deployments in the last six months were not planned but were performed to address a user-facing bug in the application?" Our data analysis confirmed our hypothesis that rework rate and change failure rate are related."
"Change failure rate and rework rate are used when we describe software delivery stability. This factor measures the likelihood deployments unintentionally lead to immediate, additional work."

Page 19: "We did find that respondents working in larger organizations report less reliance on AI in their daily work than respondents working in smaller organizations, which is consistent with prior literature indicating larger firms more slowly adapt to technological change because of their higher organizational complexities and coordination costs.5
linkSection: Exploring the downstream impact of AI
"Productivity, for example, is likely to increase by approximately 2.1% when an individual’s AI adoption is increased by 25% (see Figure 7). This might seem small, but this is at the individual-level. Imagine this pattern extended across tens of developers, or even tens of thousands of developers."
Generally: Less complexity & tech debt, more code quality & especially, documentation quality
How was this benefit determined? "Our goal here is to understand if these aspects seem to vary as a function of adopting AI..."
They seem to be calculating the correlation between organizations w/ "more AI adoption" and organization that claim "low code quality" or "high technical debt"?
Not hard to imagine a variety of ways that "an organization that adopted AI" may vary from an organization that doesn't (including one they mention elsewhere: "startup" vs "big business," which these stats could equally be said to measure?)
The model that the team provides to illustrate how the "If AI increased by 25%" is provided on page 116 of the models section. It does not contradict the assumption that the "Capability" of "AI Adoption" could covary with the characteristics of the company, such as its size.
If AI adoption increases by 25%... Delivery Stability decreases by 7.2%
Delivery throughput decreases by 1.5%
"Contrary to our expectations, our findings indicate that AI adoption is negatively impacting software delivery performance. We see that the effect on delivery throughput is small, but likely negative (an estimated 1.5% reduction for every 25% increase in AI adoption). The negative impact on delivery stability is larger (an estimated 7.2% reduction for every 25% increase in AI adoption). This data is visualized in Figure 10."
"We hypothesize that the fundamental paradigm shift that AI has produced in terms of respondent productivity and code generation speed may have caused the field to forget one of DORA’s most basic principles—the importance of small batch sizes. That is, since AI allows respondents to produce a much greater amount of code in the same amount of time, it is possible, even likely, that changelists are growing in size. DORA has consistently shown that larger changes are slower and more prone to creating instability"
Page 41: "High-performing teams and organizations use AI, but products don’t seem to benefit."
"Drawing a connection from these outcomes to an individual adopting AI is difficult and noisy. Sometimes it feels like we’re trying to analyze the impact of what you had for lunch today on how well your organization performs this year."
linkSection: Platform Engineering
"A key factor in the success is to approach platform engineering with user-centeredness (users in the context of an internal developer platform are developers), developer independence, and a product mindset."
"In this year’s report, we sought to test the relationship between platforms and software delivery and operational performance. We found some positive results. Internal developer platform users had 8% higher levels of individual productivity and 10% higher levels of team performance. Additionally, an organization's software delivery and operations performance increases 6% when using a platform. However, these gains do not come without some drawbacks. Throughput and change stability saw decreases of 8% and 14%, respectively, which was a surprising result."
Page 51: "At both the team and individual level we see a 5% improvement in productivity when users of the platform are able to complete their tasks without involving an enabling team. This finding points back to one of the key principles of platform engineering, focusing on enabling selfservice workflows."
"In the case of throughput, we saw approximately an 8% decrease when compared to those who don’t use a platform. We have hypotheses about what might be the underlying cause."
"When considering the stability of the changes to applications being developed and operated when using an internal developer platform, we observed a surprising 14% decrease in change stability. This indicates that the change failure rate and rate of rework are significantly increased when a platform is being used."
linkSection: Developer Experience
"For example, a recent survey showed that 93% of workers reported that it’s important to have a job where they feel the work they do is meaningful. In a similar vein, another survey found that on average, respondents were willing to relinquish 23% of their entire future earnings if it meant they could have a job that was always meaningful."
"We find that teams that have shifted [to adding AI-powered experiences into your service or application] have a significant 10% decrease in software delivery stability relative to teams who have not. Here is a visualization depicting the challenge."
"What can organizations do? Our findings show the negative effects of unstable priorities are resistant to having good leaders, good documentation, and a user-centered approach to software development. This leads us to believe that, aside from creating stability, there’s not much organizations can do to avoid burnout aside from finding ways to (1) stabilize priorities and (2) shield employees from having their day-to-day be impacted by the constant shift in priorities."
"This year, we saw that transformational leadership leads to a boost in employee productivity. We see that increasing transformational leadership by 25% leads to a 9% increase in employee productivity."
"Our research found a statistically significant relationship between the above qualities of leadership and IT performance in 2017. High-performing teams had leaders with strong scores across all five characteristics and lowperforming teams had the lowest scores. Additionally, we saw that there’s a strong correlation between transformative leadership and Employee Net Promoter Score (eNPS), the likelihood to recommend working at a company."
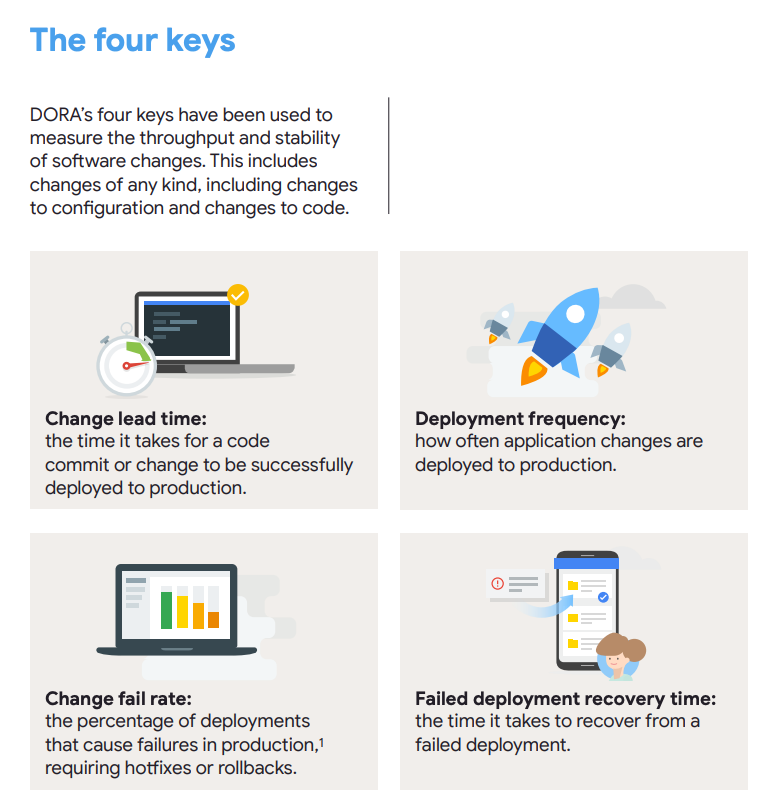
"The value in the metrics lies in their ability to tell you if you are improving. The four key metrics should be used at the application and service levels, and not at the organization or line-of-business level. The metrics should be used to visualize your efforts in continuous improvement and not to compare teams — and certainly not to compare individuals.
"As our research progresses and evolves, we encourage you to think beyond the four keys. It has become clear that user feedback metrics are as important as the four key metrics. We believe this is because most teams have devised workable solutions for improving speed and stability. As a result, the benefits gained by speed and stability are diminished as higher performance becomes ubiquitous."
"We believe metrics are a requirement for excellence. Metrics facilitate decision making. The more metrics you collect, quantitative and qualitative, the better and more informed decisions you can make. People will always have opinions on the value of the data or the meaning of the data, but using data as the basis by which to make a decision is often preferable to relying on opinion or intuition."
Page 75: "Be all-in on cloud or stay in the data center"
linkSection: A Decade with Dora
Final sections: