With more than 100 different metrics that customers can browse across GitClear's "AI ROI," "Issues," "Commits," "Pull Requests" and "DORA," it can be time-consuming to navigate to every report that's relevant to your current quarter's needs.
Starred Reports, available under the "Work in Review" tab, offer a means to collect your favorites into a single location.
For many executives & managers, we recommend setting "Starred Reports" as your default post-login page. This guide will show you how to use one of GitClear's most powerful tools.
linkAdding a new Starred Report
There are a couple different ways to add new reports to your list of favorites.
linkAdding by specifying what you want
When you visit "Work in Review" => "Starred Reports," you'll find an option labeled "Find & add reports." This lets you search for -- and add -- metrics by their title, or by what problem you want a metric to solve.
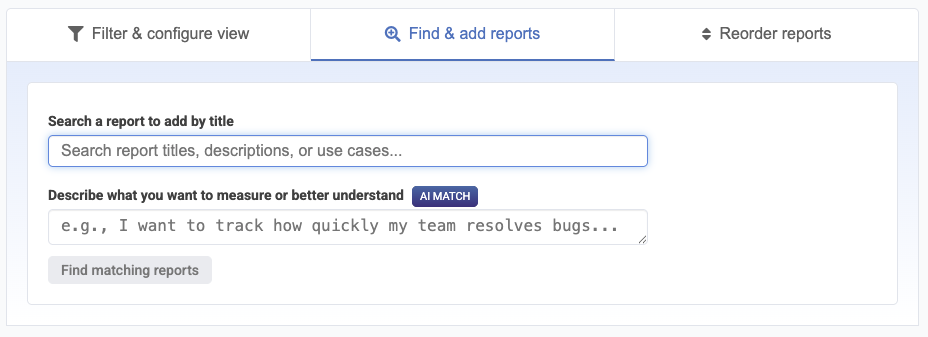
You can enter exact words ("pull request", "defect", etc) into the "Search a report" box, or you can specify natural text to search metrics by intent:
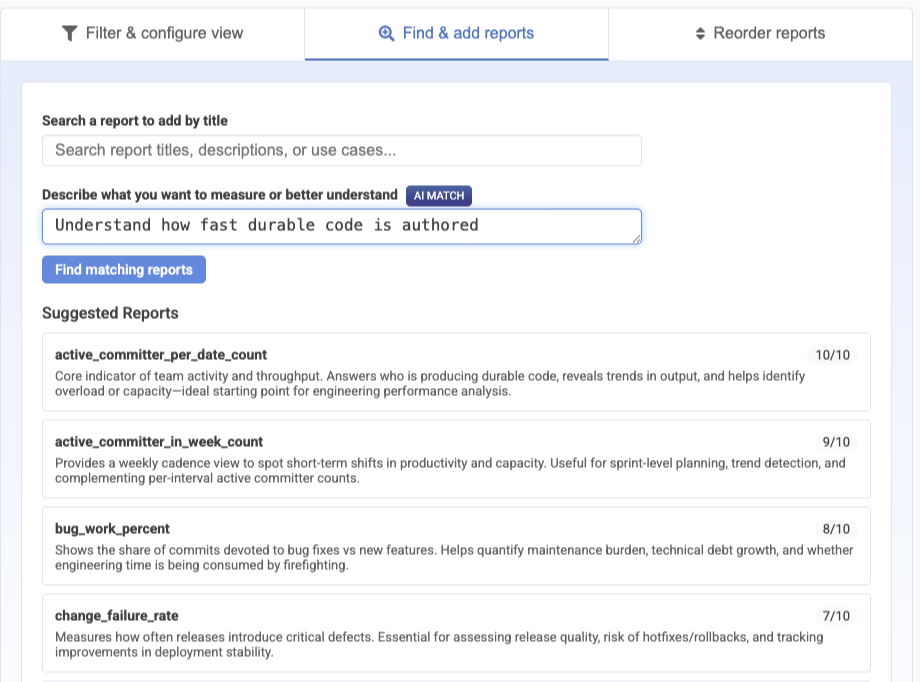
Browse suggested metrics by intent, click to add to favorites
linkAdding by browsing charts
When you are logged in, you will see an empty star next to every report that you have not already designated as a "favorite." Clicking the star adds it to your collection:
Favorite reports can originate from any of GitClear's many tabs.
linkReviewing Starred Reports
You can review the reports you have starred as a sub-tab of the Work in Review tab.
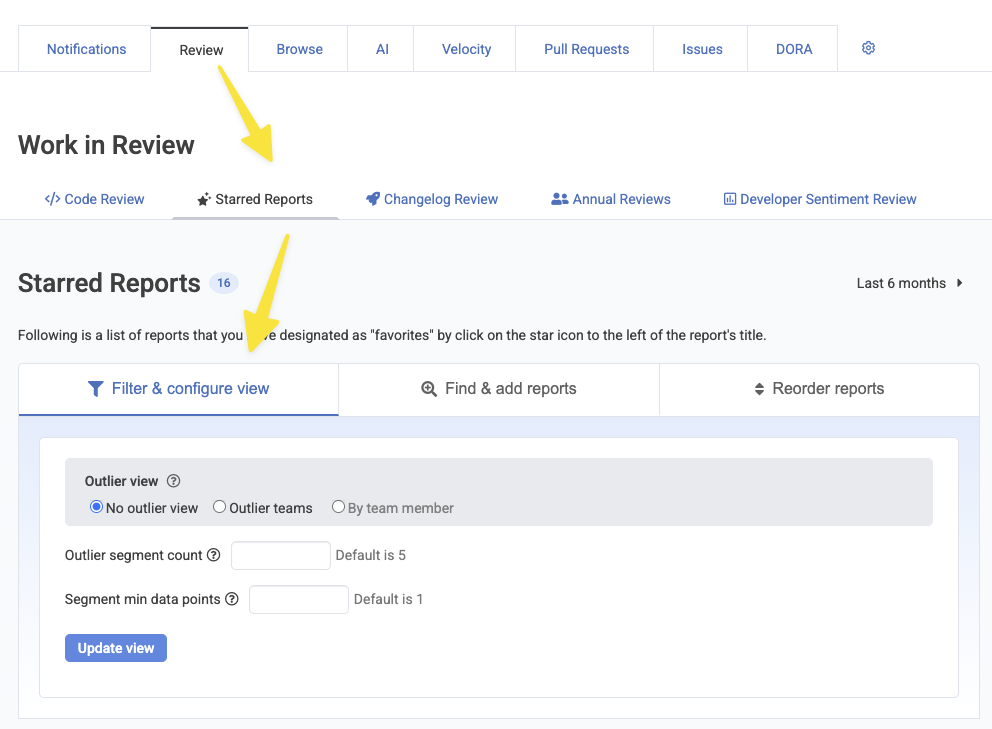
Browsing through Starred Reports from the "Starred Reports" tab
linkChanging Report Order
You can adjust the order that reports are shown in two ways: either click the "Reorder Reports" tab at the right of the screen when you visit "Starred Reports" to drag-and-drop reports into place:
Opening "Starred Reports Order" to pick the order that reports are shown in
Alternately, when you hover on a report in "Outlier View", you'll see "Up" and "Down" arrows in the middle of each row. Clicking an arrow will sort the report up or down your list. This can let you gradually shuffle metrics that become more-or less-valuable as time passes.
linkFinding Outlier Key Product Indicators (KPIs)
The Starred Reports tab facilitates KPI evaluation by letting management see which Teams or Repos are performance outliers:
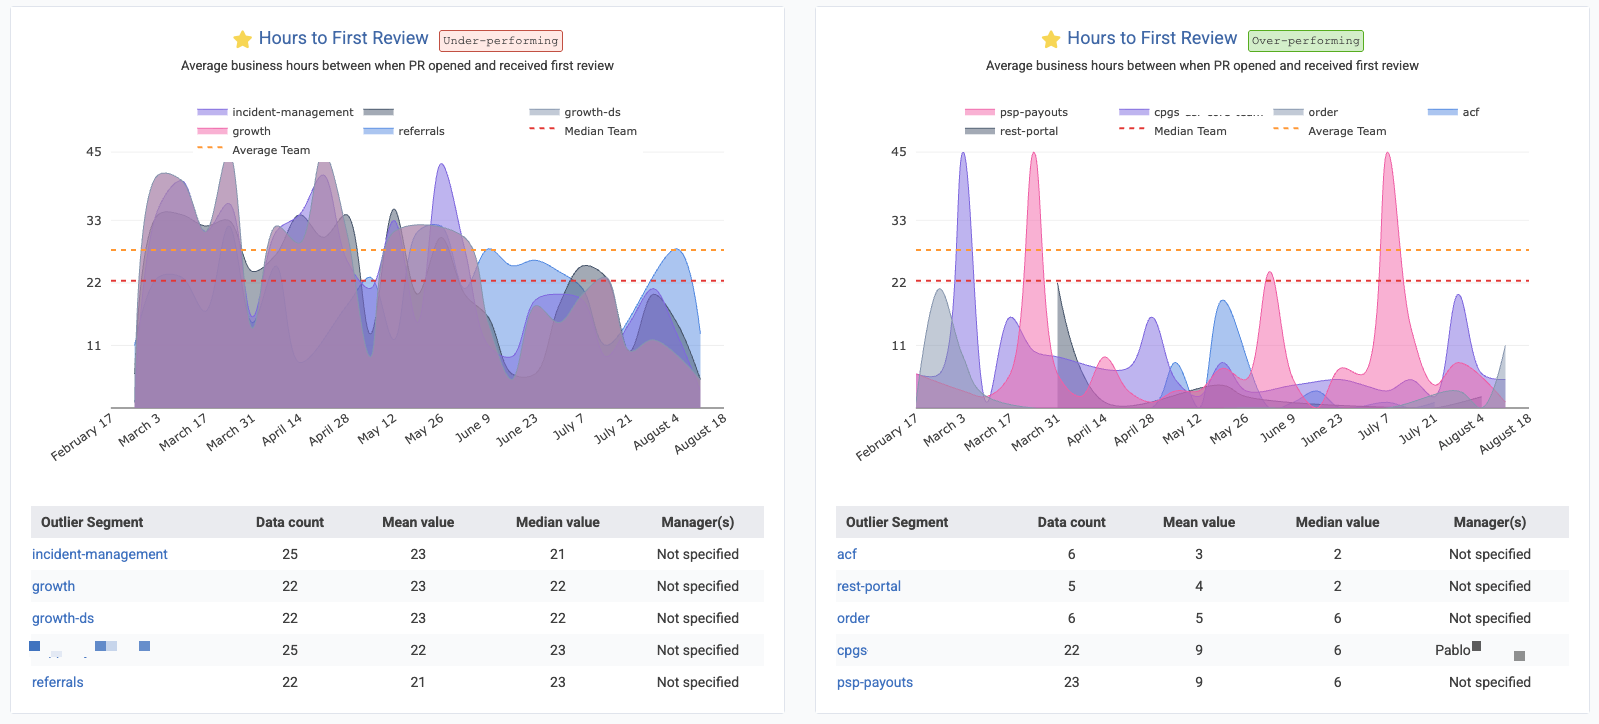
A full description of how to use Starred Reports to isolate outliers is available on the Outlier Help documentation.
Any chart among the Starred Reports can have its data downloaded as a CSV file to be input into an LLM to translate your team's multi-variate performance into a narrative that can be used to identify teams that lead the way in their efficacy.