The more you look at the Commit Activity Browser, the more you can start to find patterns in how different bubble arrangements translate to different takeaways. This page contains several empirical screenshots of the Commit Activity Browser for Alloy (our company) during various stages of development.
It also serves as a de facto museum of previous Commit Activity Browser versions as we have evolved from v1 to v10.
linkCommon patterns to observe when the team is progressing
linkDiff Delta explosion: Removing legacy functions

The most reliable way to spike Diff Delta is by removing old functions (+ not subsequently backtracking on those changes). This snippet was from 6 hours spent ripping out about 300 lines from systems that had been implemented 3-5 years prior.
Alongside the few hundred deleted lines, there were also a number of updated lines, which are valued comparably to deletions. Both deletions and updates are valued more heavily than new code, because new code comes bundled with the implied cost of long-term maintenance.
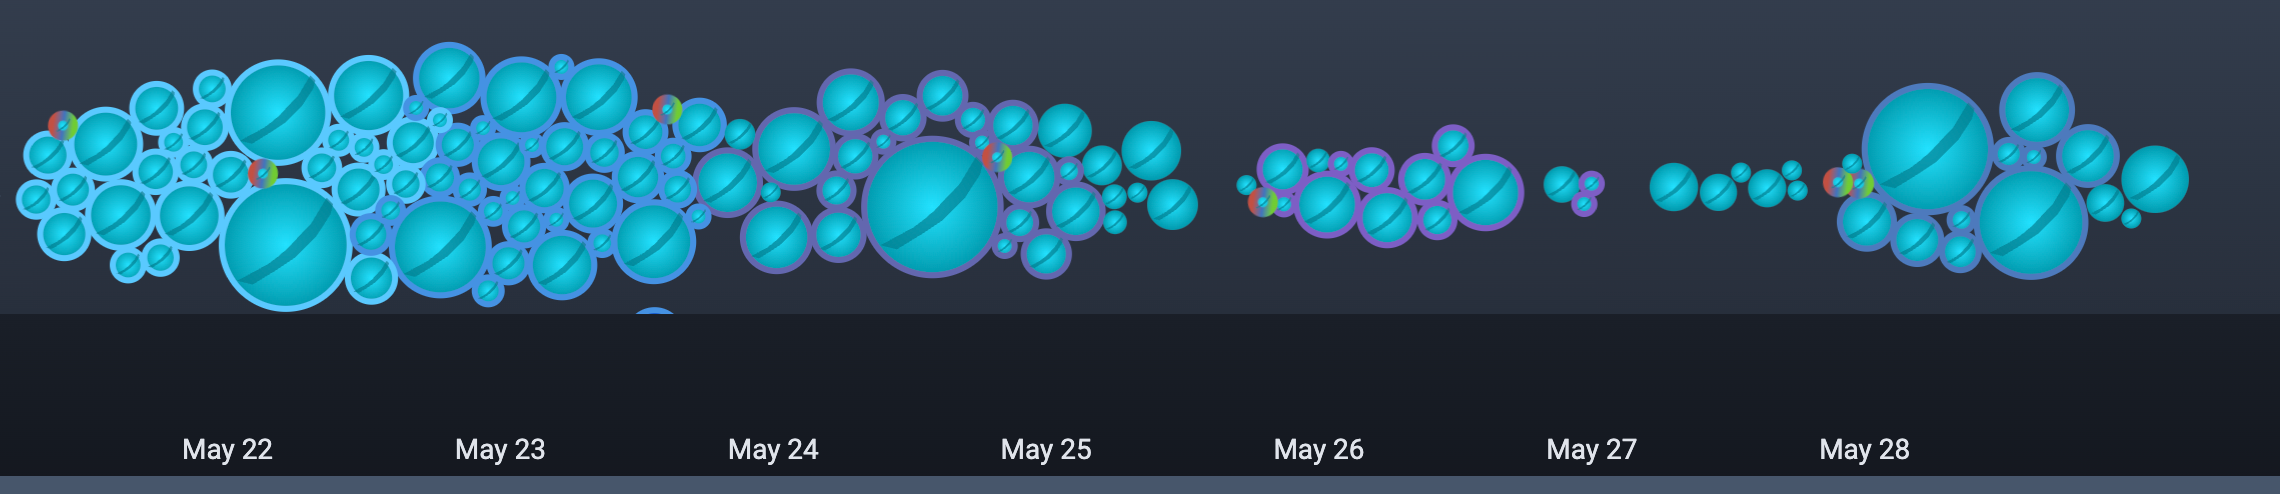
linkDistraction-heavy to distraction-free programming

This graph shows a week in changing work conditions. The small, tightly grouped commits on the left side of the picture illustrate when a programmer's attention cycle gets truncated by distractions. In this distraction-heavy half of the trip, the developer had their attention interrupted every hour or so.
During the highlighted stretch, a block of contiguous, distraction-free time opened up. It offered an opportunity for some large-scale refactoring that wouldn't be possible without longer attention cycles.
The two biggest circles (= highest Diff Delta commits) come from deleting legacy libraries that were no longer needed post-refactor.
linkProduct launch => Quick bugfixing => Hard bugfixing

A common pattern we observe is that following a big product launch, there is often a flurry of activity in response to new exceptions or warnings that get generated once the large change meets messy production data. The post-deploy flurry tends to yield a tightly focused group of commits, because the typical bug found in the aftermath of a launch is a small oversight that can be quickly remedied.
In the days that follow the launch, it's not uncommon to see a much slower pace of commits, as the developer digs in to debugging via in-depth console queries or log-spelunking. These types of debug initiatives might take 1-2 hours just to understand what the problem is, so the rate of commits will tend to slow down considerably.
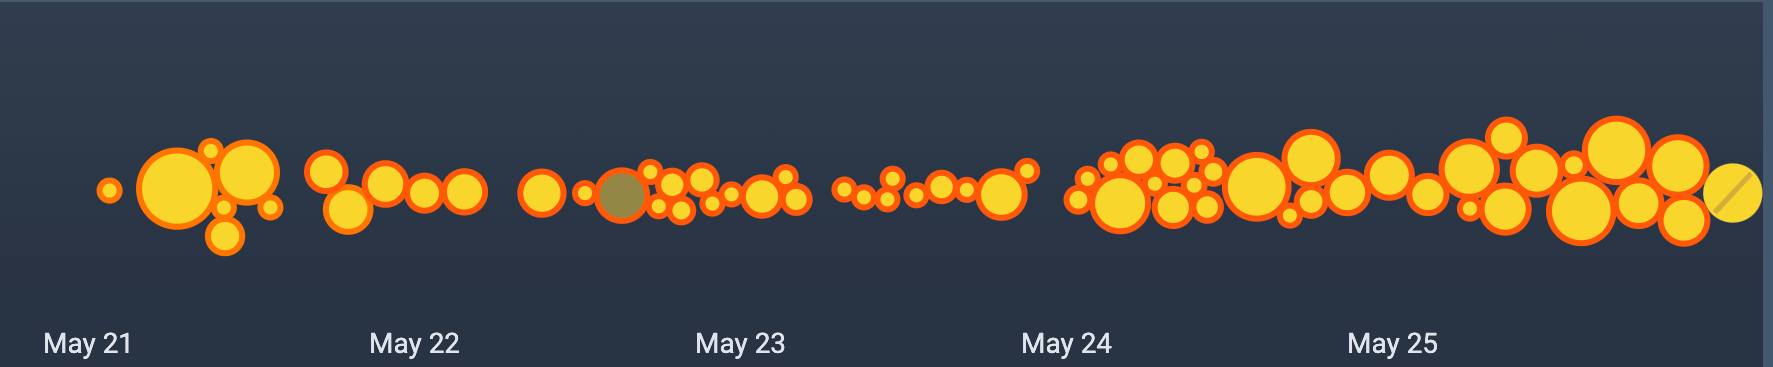
linkA developer finishing QA on an iteratively developed feature

The signature of fast iteration is lots of small bubbles grouped together. This typically indicates that the developer is making many commits that revise recent work. If a new featured launched recently, the packed circles suggests that bug fixing is happening concurrently with development. This is generally a phenomenon one wants to see in order to deliver a polished product.
linkDeveloper obsessing over a poorly understood topic
This was how it looked when a Senior Developer began working in a new repo, using libraries that were poorly understood. Note the consistently high commit volume indicating that the developer is highly engaged. The relatively small Diff Delta of each commit suggests that the committer may be revising a lot of their recent work as they better understand the conventions of the newly encountered repo.
This can be considered a "positive" pattern inasmuch as you want to allow a developer to flounder as they teach themselves something new.
linkLaunch and respond
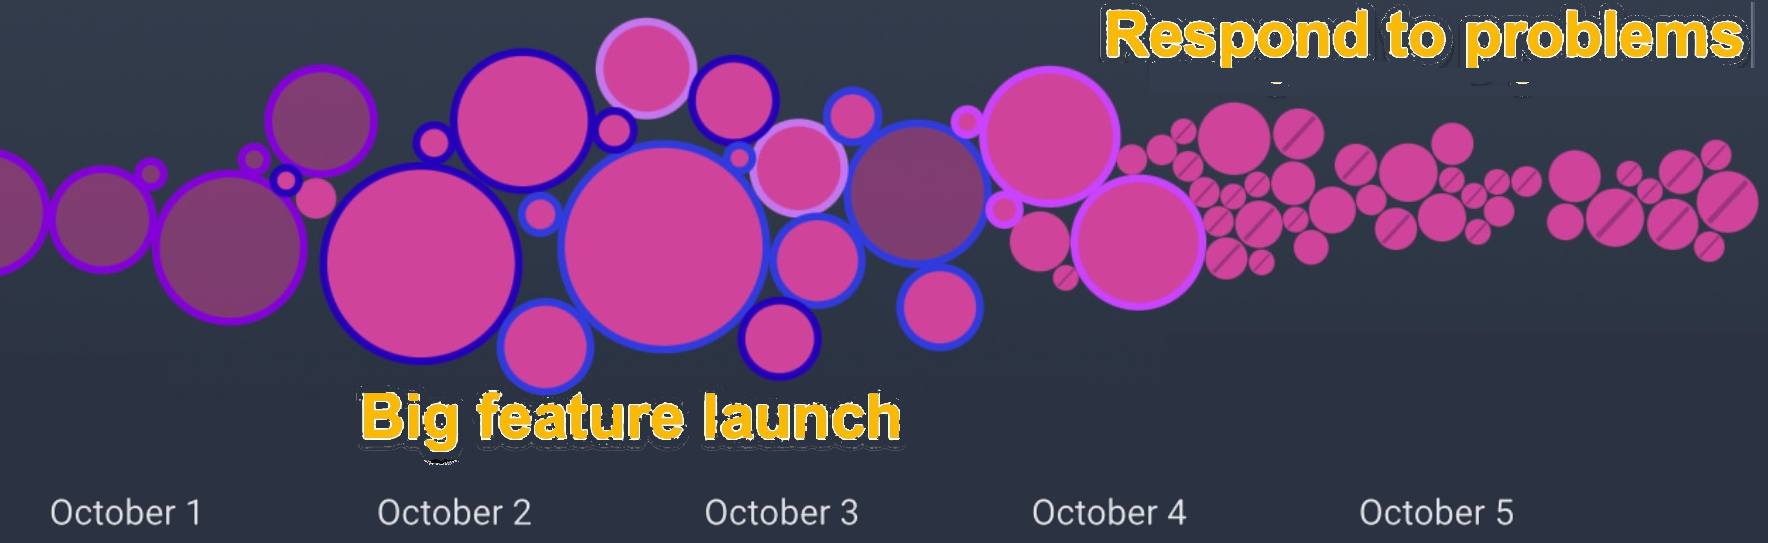
While developing he big feature, Diff Delta per commit was very high. Once the feature launches, Diff Delta per commit approaches zero as small changes are made to adapt to real-world conditions observed.
linkSenior developer working on a well-defined feature in a system they understand

The dream combination. Having a developer working from a clear spec, in a system that they are familiar with. This confluence of circumstances is how well-run companies can witness large Diff Delta per day.
linkMedium-size team working at peak efficiency

The more people on the team, the harder it is to keep all of them marching in the same direction. This CAB shows a mid-sized team that is working on all cylinders. Among 10 developers on the team, all but two are making commits daily. Also, several developers are accomplishing comparable amounts of work, that suggests this team is staffed with numerous strong engineers.
linkMedium size team working at average efficiency
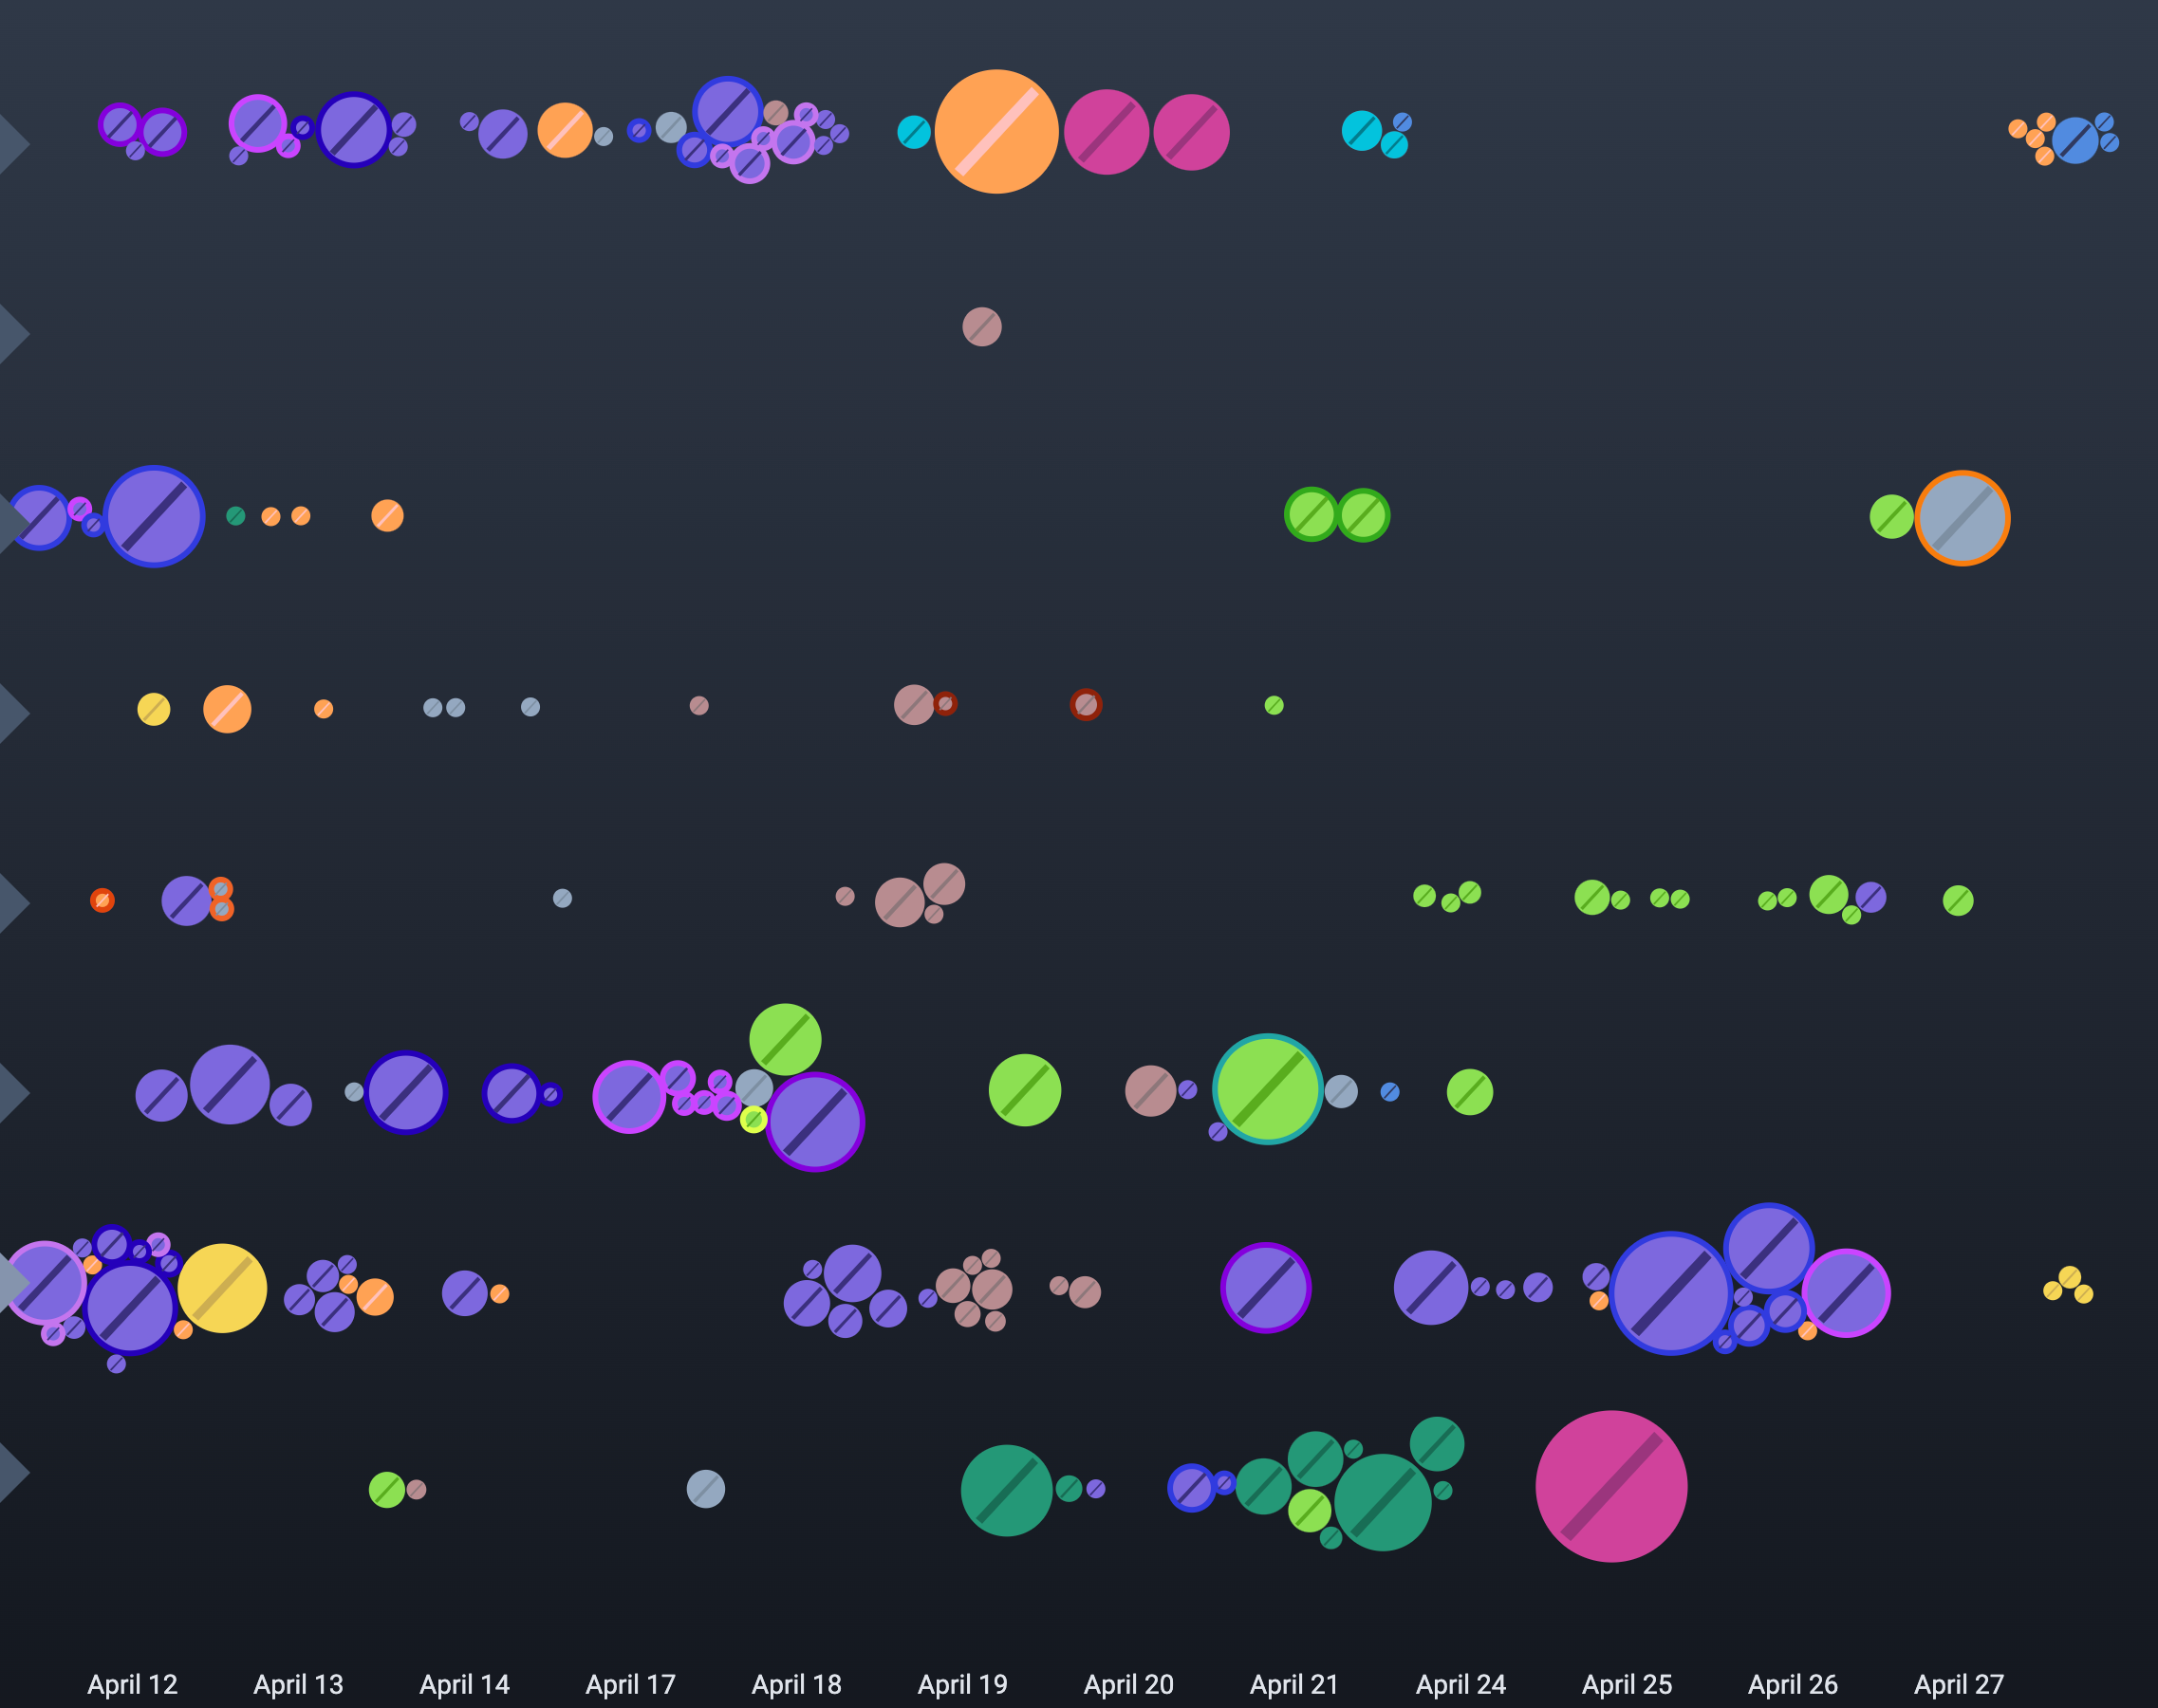
Most mid-sized teams, especially if they are new to GitClear, have a Commit Activity Browser that looks more like this than the "Peak efficiency" graph above. The graphs may appear superficially similar until you note the date range on the "peak efficiency" team being 3 days, and the date range of "average efficiency" being 2 weeks. Several developers haven't pushed any commits in the current week.
Some of these developers may be pair programming, but even in that case, you would hope to see heavy activity toggling between two developers.
linkMax output: technical founder with others away
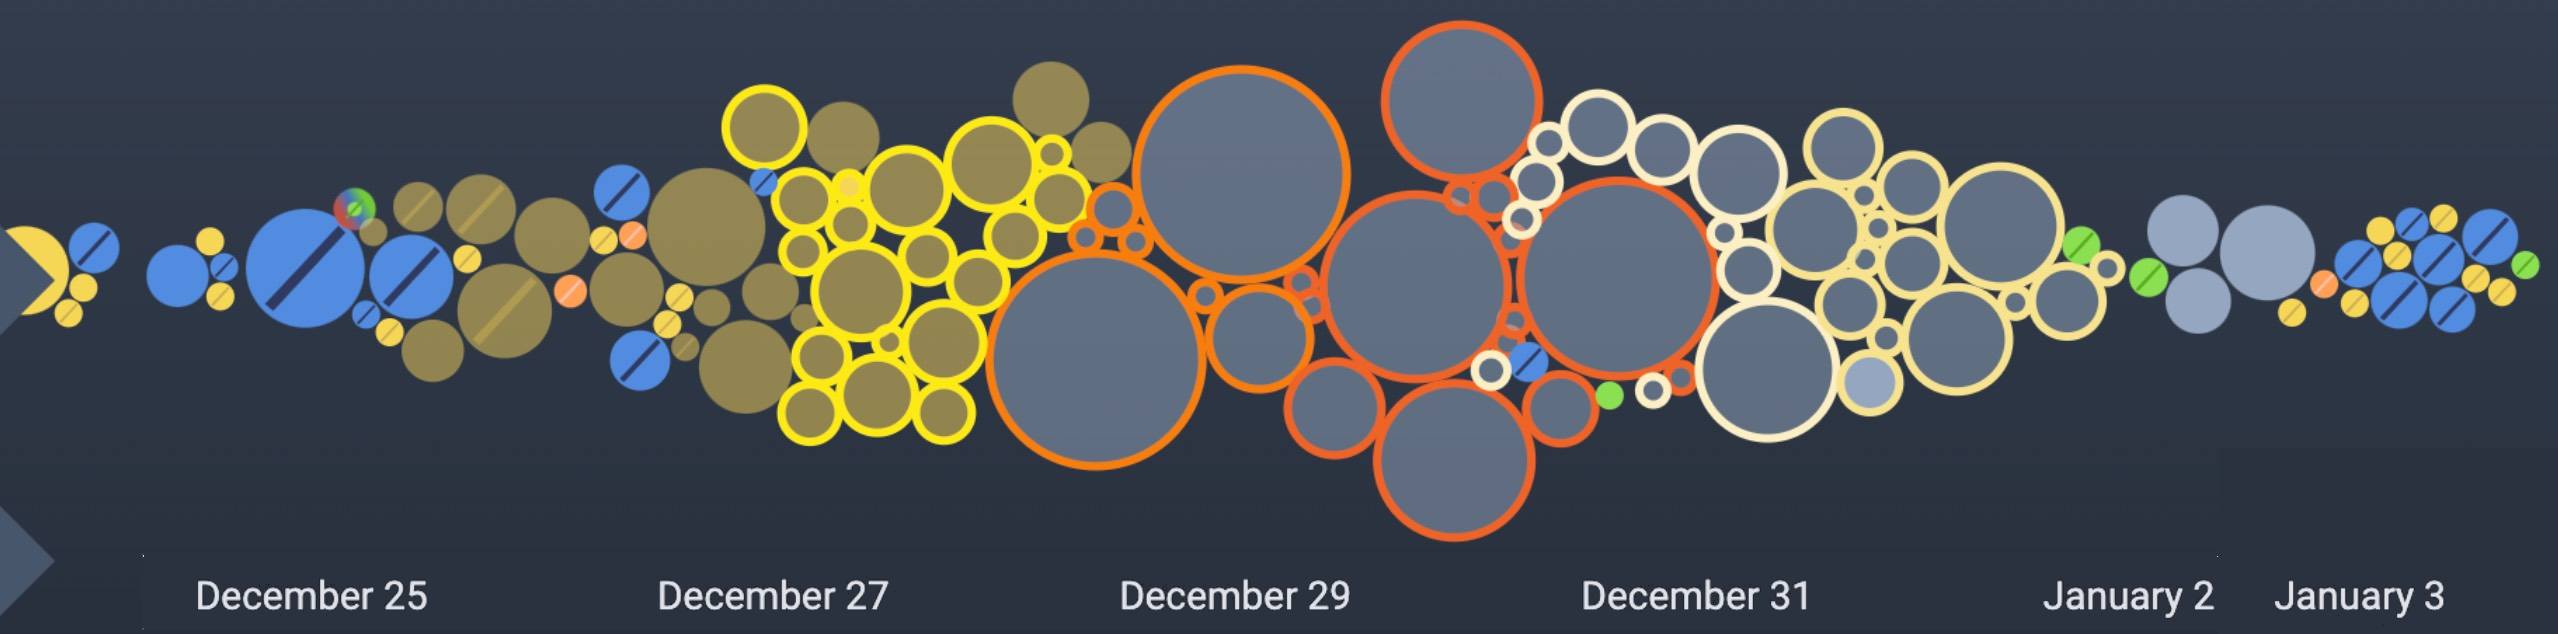
This technical co-founder worked during the holiday break to optimize the rate at which they could make changes without distraction. We recommend that all developers take regular holidays on behalf of sanity.
linkMax output II: At a conference
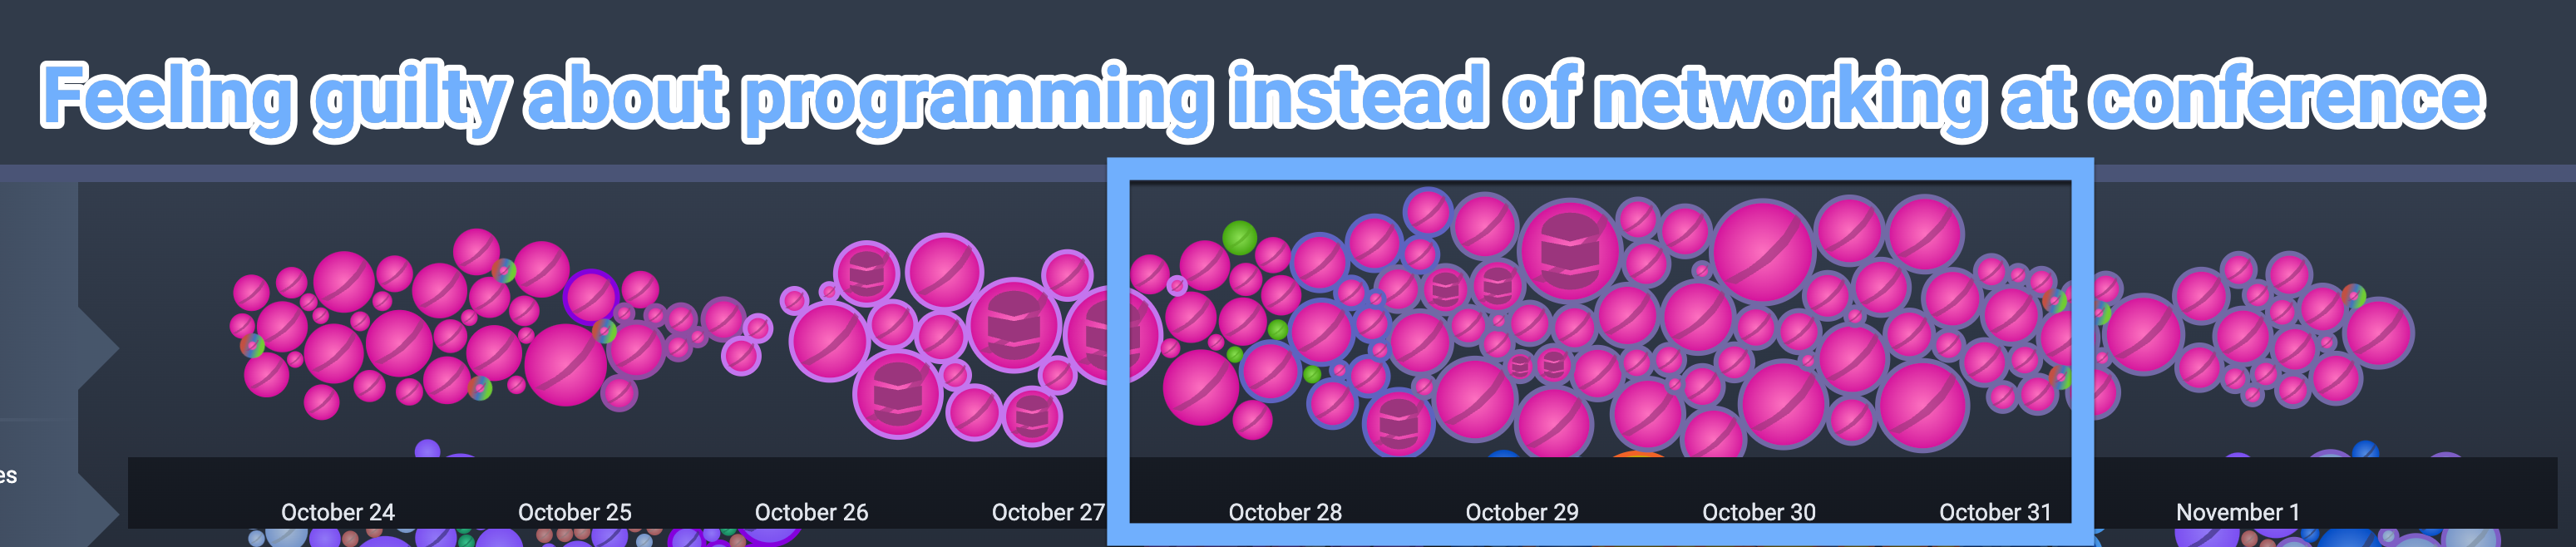
Stopped checking emails & chat messages at a conference. Expected to do networking, but absent good opportunities, dove into maximizing Diff Delta progress.
linkBig feature not ready for prime time
All these big CAB circles suggest that final form for this WIP feature has not yet coalesced. Once a feature is in its final polish stages, there will be only small bubbles, as incremental changes are made. Big bubbles like these suggest that legacy modules are being removed, which suggests that the code replacing it will require further tests/iteration.