Adoption overview: Which teams are leading the charge?
Before you can ask whether AI is making your teams faster or better, you need to know who is using it, how much of their work it touches, and how much of that work GitClear can actually see. The AI Adoption tab answers those questions on a single screen: one row per team, and one square per developer.
You'll find it under "AI Impact" => "AI Adoption":
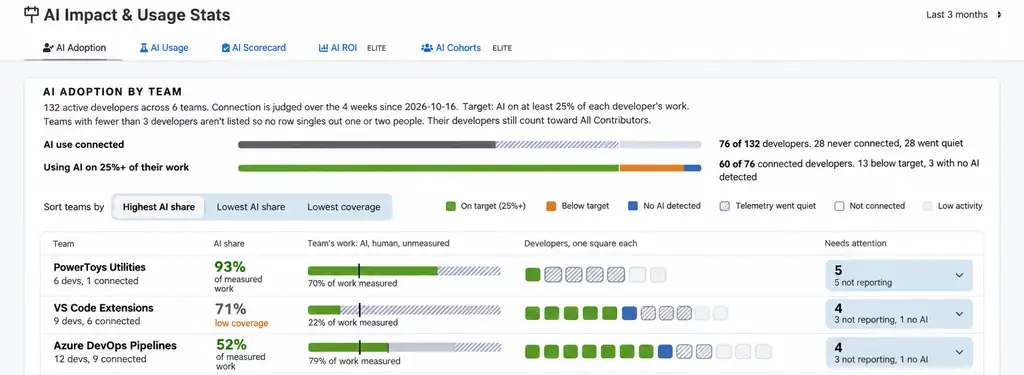
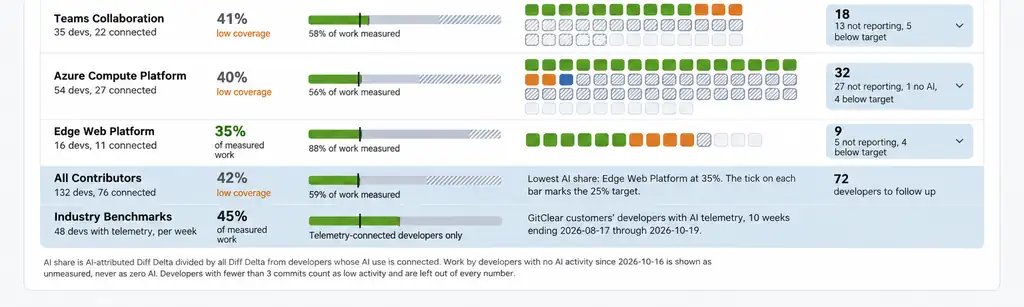
Each row is a team and each square is a developer, colored by whether AI is on at least 25% of their work
The AI Adoption tab is built to answer five questions:
Which teams are leading the charge, and which are trailing? Sort by "Highest AI share" or "Lowest AI share" to rank teams by the percent of their measured Diff Delta that was authored by AI.
How much of each team's work can we actually measure? Each team's bar splits its work into AI, human, and unmeasured. Teams with a large unmeasured share are flagged "low coverage," and the "Lowest coverage" sort brings the biggest blind spots to the top.
Which developers need a follow-up? The "Needs attention" column counts the developers on each team who aren't reporting, are below target, or have no AI detected.
Is each developer's AI use steady, growing, or fading? Hover any developer's square to see their AI share over the last 8 weeks, alongside their team's median and the target.
How does our adoption compare to other companies? The "Industry Benchmarks" row shows the AI share among GitClear customers' developers with AI telemetry, so you can tell whether 40% puts you ahead of the pack or behind it.
link📊 Interpreting the data
The AI Adoption tab is stuffed full of information about how AI is being used throughout the company.
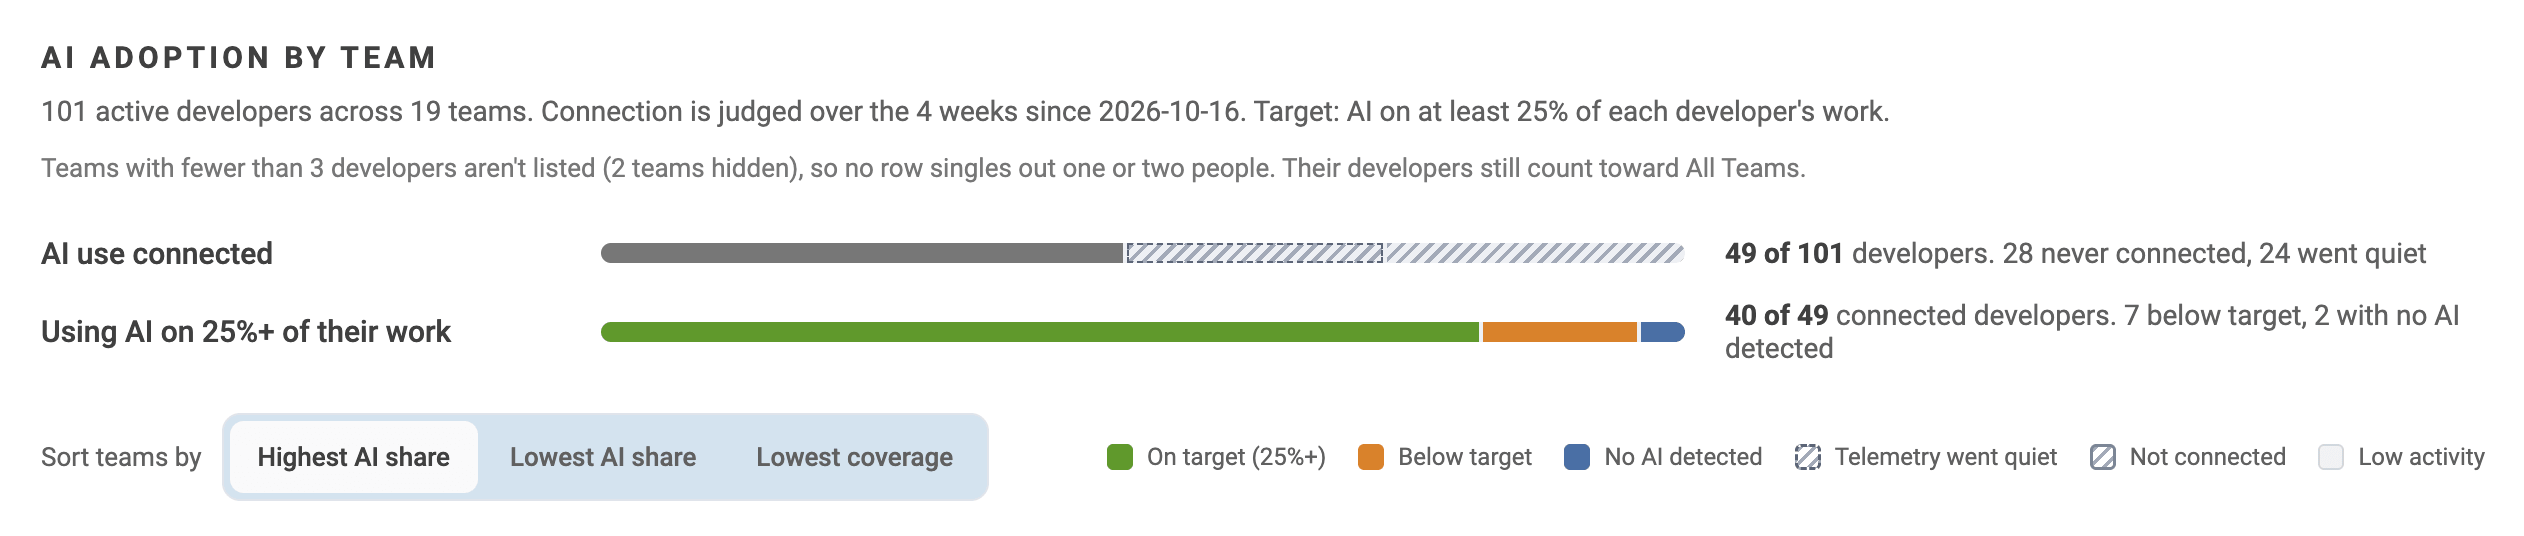
The page begins with a pair of summary bars answering "Is AI use instrumented?" and "If so, is usage on par with industry norms?"
Summary bars: "AI use connected" counts the active developers whose AI use is reporting to GitClear, along with how many never connected and how many went quiet. "Using AI on 25%+ of their work" counts how many connected developers are meeting the target. Connection is judged over the most recent 4 weeks.
Developer squares: Green is "on target" (AI on 25% or more of their work), orange is below target, blue is no AI detected, hatched means telemetry went quiet, an empty outline means not connected, and light gray means low activity.
The tick mark on each team's bar marks the 25% target.
Low activity: Developers with fewer than 3 commits in the window are left out of every number, so a quiet week doesn't drag down a team's results.
Privacy floor: Teams with fewer than 3 developers don't get their own row, so no row singles out one or two people. Their developers still count toward "All Contributors."
link👥 Authored work: AI model, human, or unmeasured?
Each team row (including the "All Teams" row) includes a bar that splits all of the team's Diff Delta (code activity) split into three groups:

AI (green): Diff Delta attributed to an LLM
Human (gray): Diff Delta from developers whose AI use is connected, but that wasn't AI-authored
Unmeasured (hatched): Diff Delta from developers who aren't connected, or whose AI telemetry has gone quiet
Why three groups instead of two? Because the most common way to get AI adoption wrong is to treat "no data" as "no AI."
If a developer never connected an AI tool, or their telemetry stopped reporting, there's no way to know whether they wrote that code by hand or with an assistant that isn't reporting. Counting their work as "human" would understate adoption, and quietly dropping it would hide how much of the picture is missing. So GitClear calculates AI share only from measured work (AI-attributed Diff Delta divided by all Diff Delta from developers whose AI use is connected), and shows the unmeasured remainder right beside it.
Unmeasured is never counted as zero AI. When a large share of a team's work is unmeasured, its AI share is labeled "low coverage," a reminder that the percentage only describes part of the team. |
The same rule applies to individual developers. Hover any square to see that developer's AI share for each of the last 8 weeks: weeks without telemetry are drawn as hatched bars, not as zero.
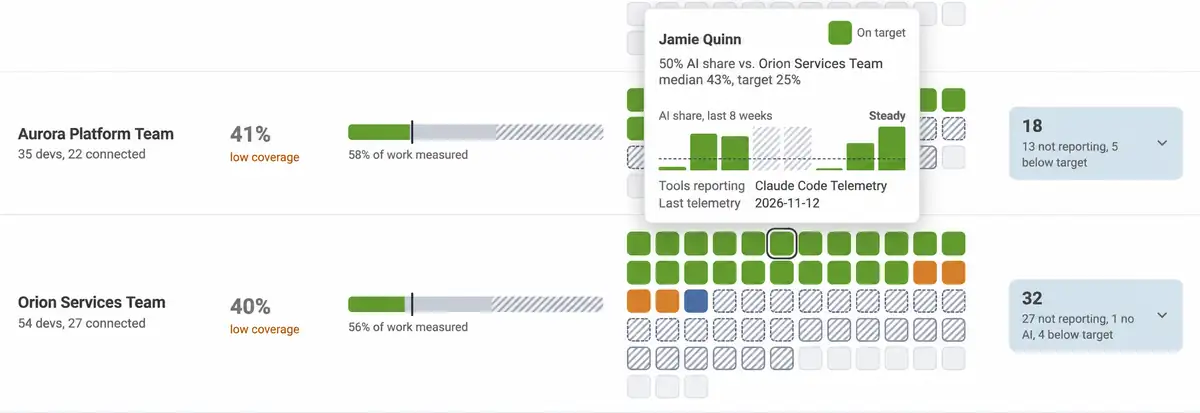
The hover card compares a developer to their team's median and the target, and shows which tools are reporting and when telemetry last arrived
linkShrinking "Unmeasured": API connection vs. telemetry
There are two ways to move work out of the unmeasured column, and they trade speed for depth.
An API connection is the fastest path to coverage. An admin enters one token per AI provider (GitHub Copilot, Cursor, Claude Code, Augment, or Gemini; see the AI provider setup guide), and every developer on that business account starts reporting at once. For many teams, this single step converts most of their "Not connected" squares into measured work. The tradeoff is that provider APIs report daily totals per developer, so GitClear has to estimate which lines in each commit came from AI by matching those totals against commit timestamps, each developer's typical velocity, and the type of change.
Telemetry (or a proxy with logs) is the granular path. GitClear's AI telemetry for Claude Code, Cursor, and Codex, or a proxy that logs LLM requests, records each agent session as it happens. Instead of estimating, GitClear knows exactly which lines were last authored by AI, what kind of task the developer asked for, and how many turns it took.
API connection | Telemetry or proxy logs | |
Setup | One admin token per AI provider | Installer on each developer's machine, or a proxy that logs LLM requests |
How fast "Unmeasured" shrinks | All at once, for everyone on the provider's business account | Developer by developer, as each machine starts reporting |
How AI lines are identified | Estimated from each developer's daily AI totals | Recorded line by line as the agent writes code |
Type of task (prompt intent) | Not available | About 20 categories, such as create, debug, fix, test, and restructure |
Turns, runtime, and cost per task | Not available | Available for every session |
Tabs it powers | AI Adoption, AI Usage, AI ROI, AI Cohorts | All of those, plus the AI Scorecard's durability curve and Task-Model ROI Matrix |
The strongest setup uses both: an API connection for blanket coverage today, and telemetry for the teams where you want to learn what's actually working.
link🔭 Actionable goal: Enhance telemetry
A team's unmeasured percentage is one of the clearest signals of how seriously it takes learning from its AI spend. When you recognize and reward the teams that drive "Unmeasured" toward zero, you reinforce a company value: we don't guess whether our tools are working; we measure, learn, and improve.
And because unmeasured work is never scored as zero AI, no team "loses points" by connecting more developers. Better coverage simply makes its AI share believable.
Sort by "Lowest coverage." The teams at the top have the most work hidden from view, and the least trustworthy AI share.
Open "Needs attention." Each team's card counts the developers who aren't reporting. Expand it to see who makes up the count.
Separate "never connected" from "went quiet." Developers who never connected usually need an API seat or the telemetry installer. Hatched squares usually mean something changed, like a new machine, a new editor, or a switch to a tool that isn't connected yet. Hover the square to see which tools are reporting and when telemetry last arrived.
Make "% of work measured" a team goal. Pick a target (90% measured is a good start) and review it in the same meeting where you review AI share.
Reward the teams that close the gap. A shout-out at the all-hands, first access to new AI tool pilots, or budget for premium models are all low-cost ways to show that being measurable is valued.
Upgrade your best-covered teams to telemetry. Teams already near full API coverage are ideal candidates to install telemetry next, since their richer data feeds the AI Scorecard.
link🏃 Actionable goal: Constant improvement
Every company has a few teams that figured out AI earlier than the rest. The AI Adoption tab shows you who they are, so the rest of the organization has a working prototype to follow instead of a mandate to figure it out from scratch.
Find leaders you can trust. Sort by "Highest AI share," then check coverage before crowning a winner. In the example above, the top team's 93% AI share comes from just 1 of its 6 developers, while the third team's 52% comes from 9 of 12 developers with 79% of its work measured. The second is a much sturdier pattern to learn from.
Meet with the managers of the teams leading the way. Ask which tools and models they use, and for which kinds of tasks. How did they get developers started: pairing, internal demos, shared prompts, or repo conventions like AGENTS.md? Did they change how they review or test AI-authored code? What did they try that didn't work?
Pair leading and trailing teams. A 30-minute conversation between a manager whose team is at 50% and one whose team is at 20% is often more persuasive than any policy memo.
Watch trends, not just snapshots. The hover card compares each developer to their team's median and labels their 8-week trend (e.g., "Steady"). Developers trending upward after an intervention are evidence it worked. Developers fading below target are candidates for a check-in, not a reprimand.
Re-check monthly. As practices spread, more teams should cluster near the top of the "Highest AI share" sort, and the "Industry Benchmarks" row tells you whether the company as a whole is keeping pace.
link🗺️ Beyond Adoption: Next Steps
The AI Adoption tab handles the first step: getting developers engaged with the AI tools available to them. But a high AI share only tells you a team uses AI, not whether that AI is helping it ship durable code faster. The other tabs in GitClear's AI section are where the rubber meets the road, evaluating how much the AI-backed cohorts accelerate delivery:
AI Usage: See which models and providers each team relies on, what each costs, and how many lines each adds and deletes. Aggregate by committer to learn each developer's preferred models.
AI Scorecard: Learn which models write code that survives review and is still standing at Day 60, and which model delivers the best value for each type of task. Most charts require telemetry or proxy logs.
AI ROI (Elite): Compare AI users against non-AI users on Diff Delta, commits, churn, test work, duplication, review time, and story points to quantify the return on your AI spend.
AI Cohorts (Elite): Track how velocity and quality evolve week by week for Non, Sparse, Periodic, Regular, and Power AI users, to see whether heavier AI use is paying off over time.