When navigating the sometimes-complex world of Google DORA stats, it's not uncommon to furrow the brow and wonder: why?
Why did my "releases with defect percent seem to skyrocket last month?"
Why do I keep getting notifications about critical defects being unsolved?
Why do we keep missing our sprint deadlines as I see this Change Lead Time
Why does it seem to be taking so long to see the fix for this customer-facing issue? I thought the devs were done?
Why are we seeing so many defects in general lately? Does this correlate with our growing AI adoption?
These are the types of specific investigations where the Critical Defect Data Browser, and the individual defect details that can be accessed from the table, can provide all the specific details needed to learn from past challenges.
linkGetting Granular to Find Truth
While GitClear is visually defined by the numerous Google DORA stats that can be graphed, once you find the big picture graph spike, step 2 is usually to “double click” and go deeper into what was happening during an outlier period of time for some team, repo, organization, or committer. That’s where the Defect Browser becomes a powerful tool to cultivate deeper understanding.
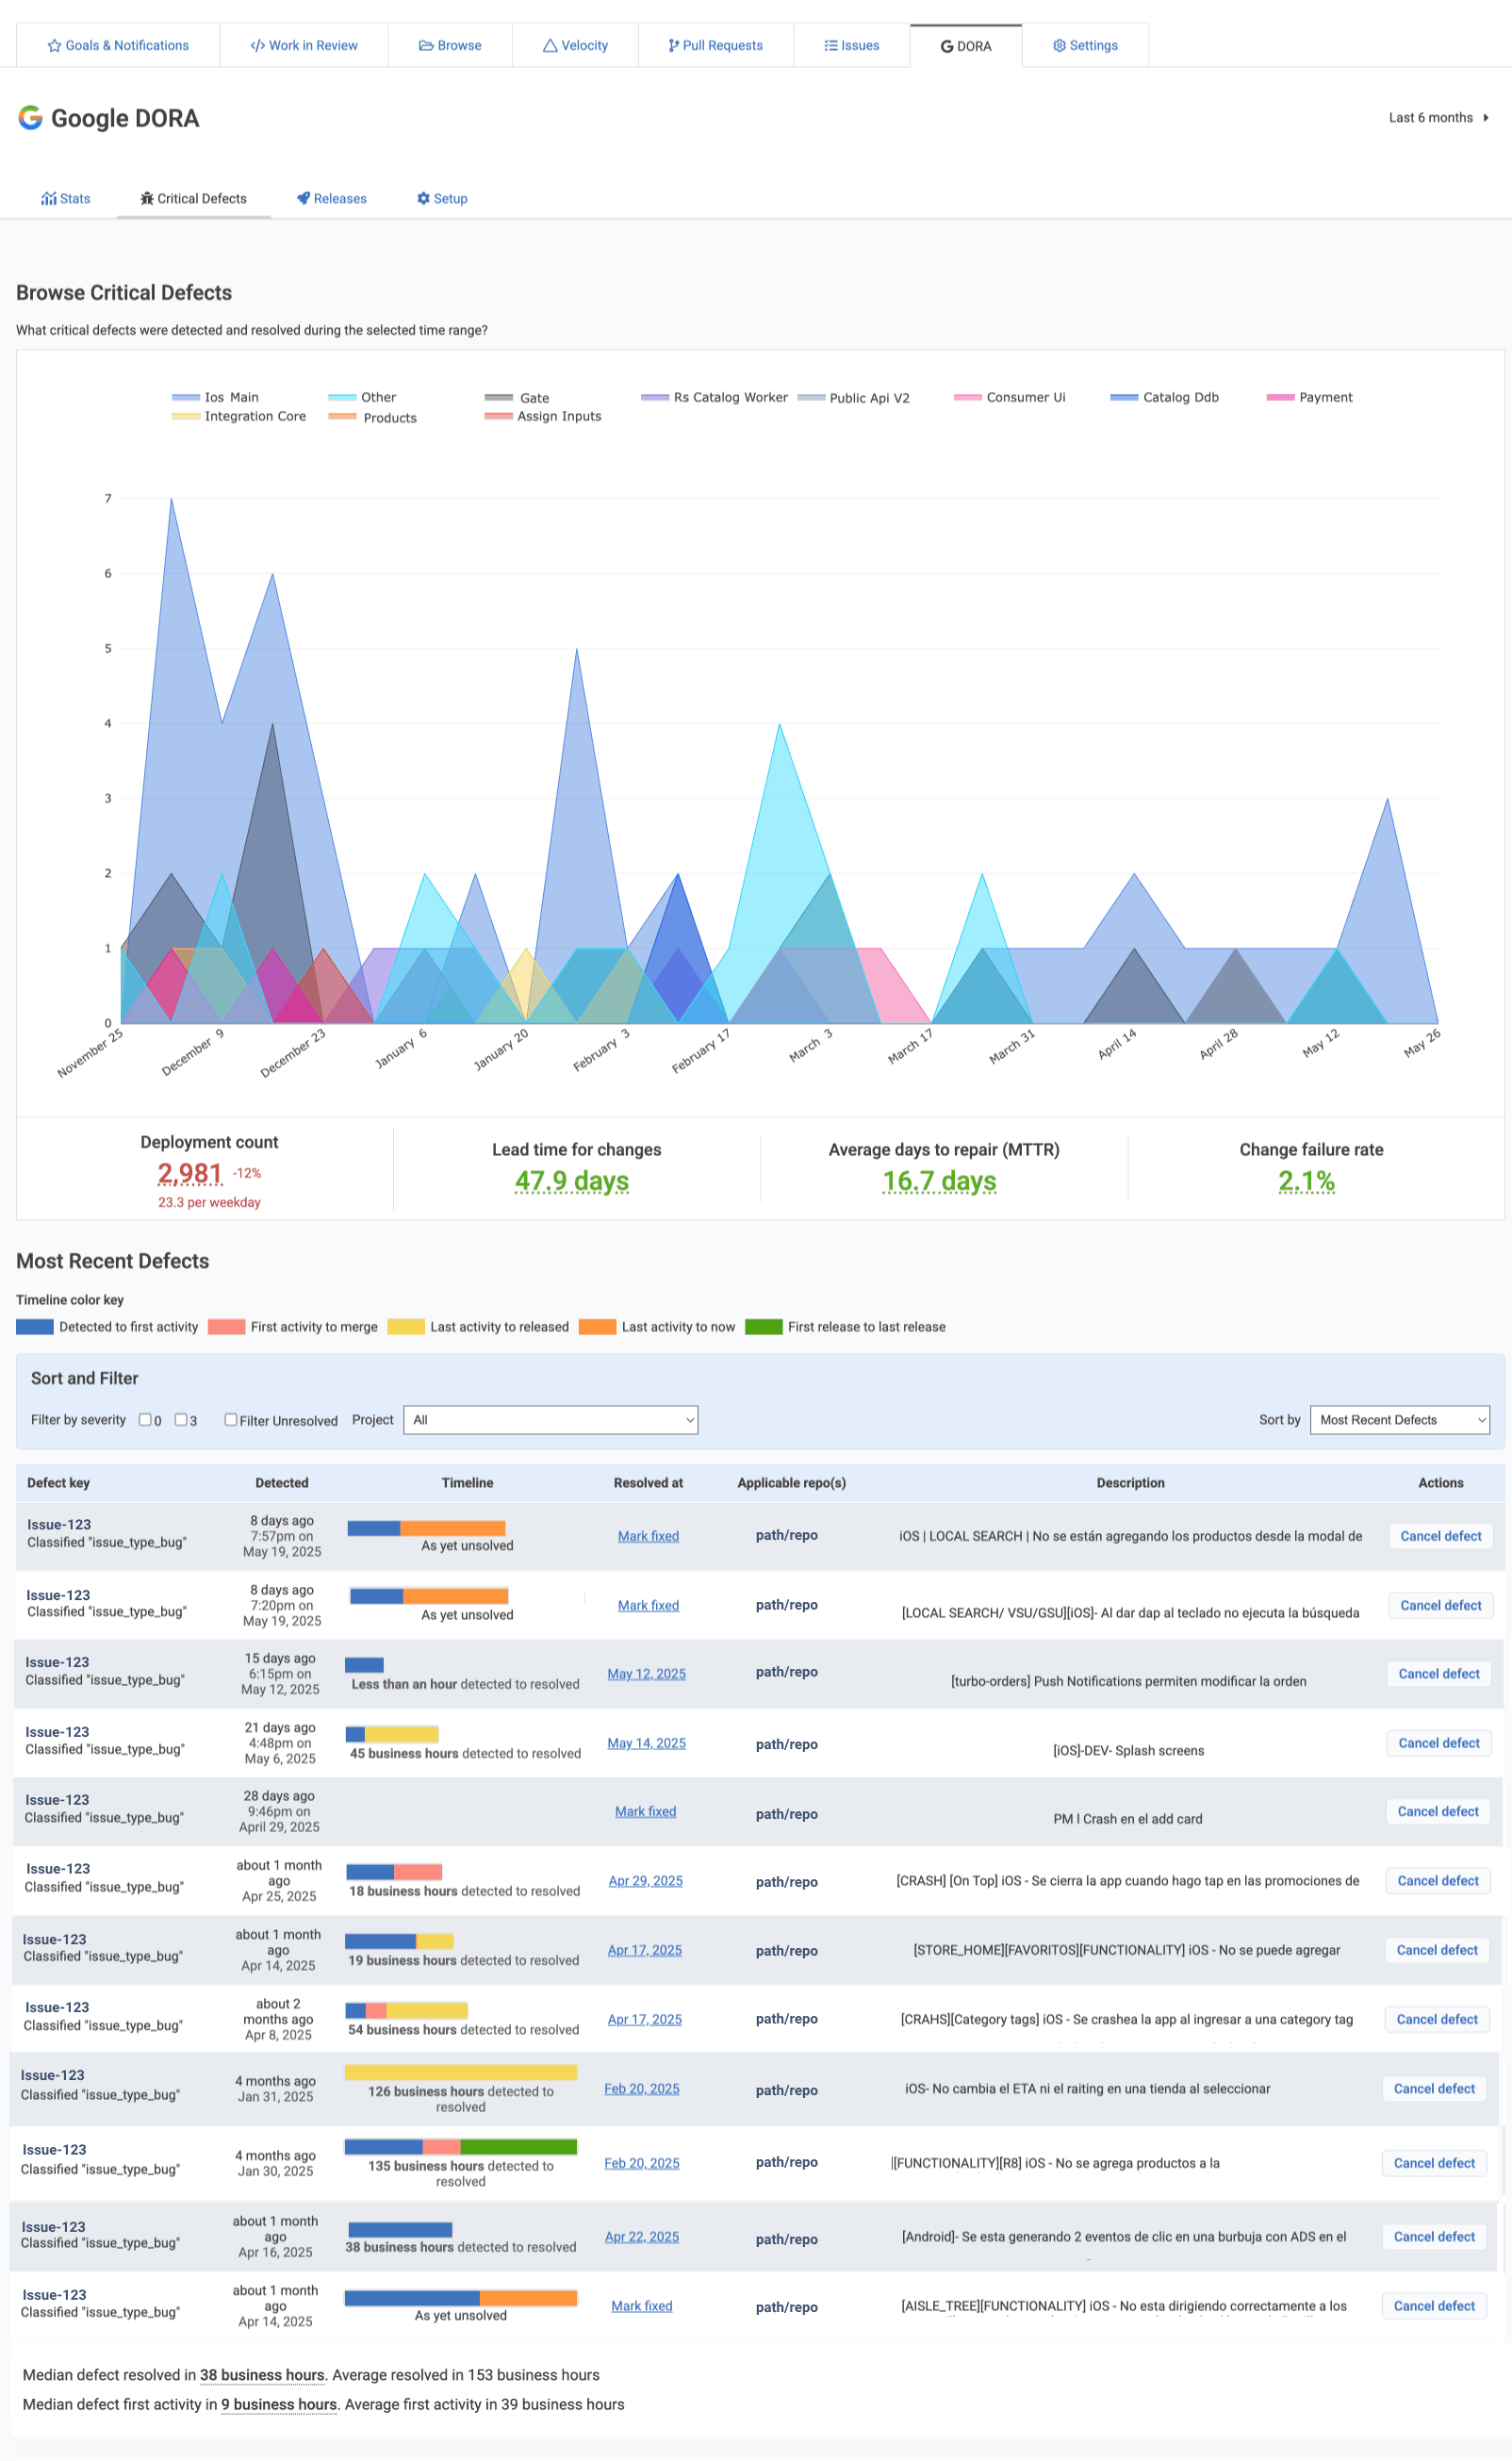
Defect Browser combines individual issues with aggregates stats showing which repos have had the greatest amount of defect activity in recent history
The Defect Browser table also allows:
Defects to be marked newly resolved
Click date field to change the date at which a defect is marked resolved
Cancel (destroy) the defect if it's not applicable
Note that each defect has a timeline for its resolution, broken into separate categories:

Detected to first activity: Time between issue opened and an initial commit being authored
First activity to merge: First commit to pull request merge time, if the issue was solved via pull request
Last activity to release: Later of "last commit authored at" or "PR merge time." Basically, "how long did it take for this to get deployed after the dev work was done?"
Last activity to now: For defects that are still open, we don't know how long it will take for them to be released
First release to last release: If a defect is resolved in multiple releases, this will show the time that elapsed between the first and last fixes being released to make this defect gone for good.
linkFiltering Defects
It is possible to filter issues by their severity rating, their project, and whether they are solved or not:
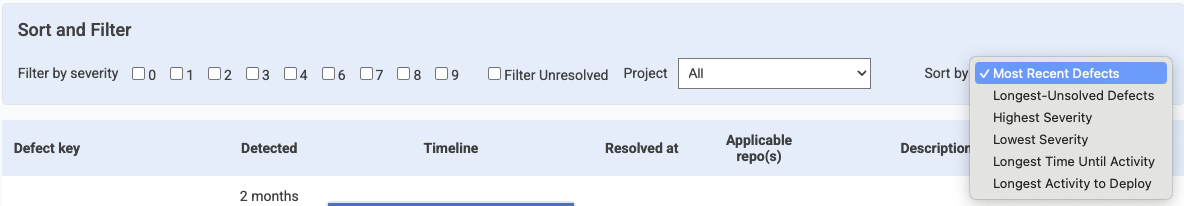
Assorted options for filtering defects from the total set
Of course, the only defects the table will show are those that fall within the date range selected, and the team and repo selected.
It's also possible to sort defects, helping to analyze those that had the longest time to get resolved -- potentially combined with a filter for issues of a high severity.
linkLooking Deeper Still: Per-Defect Details
If you click on the issue identifier at the left edge of the table, you'll get even more fine-grained information about how the issue was detected, what its severity is labeled as, and what its release & development cycles have involved.
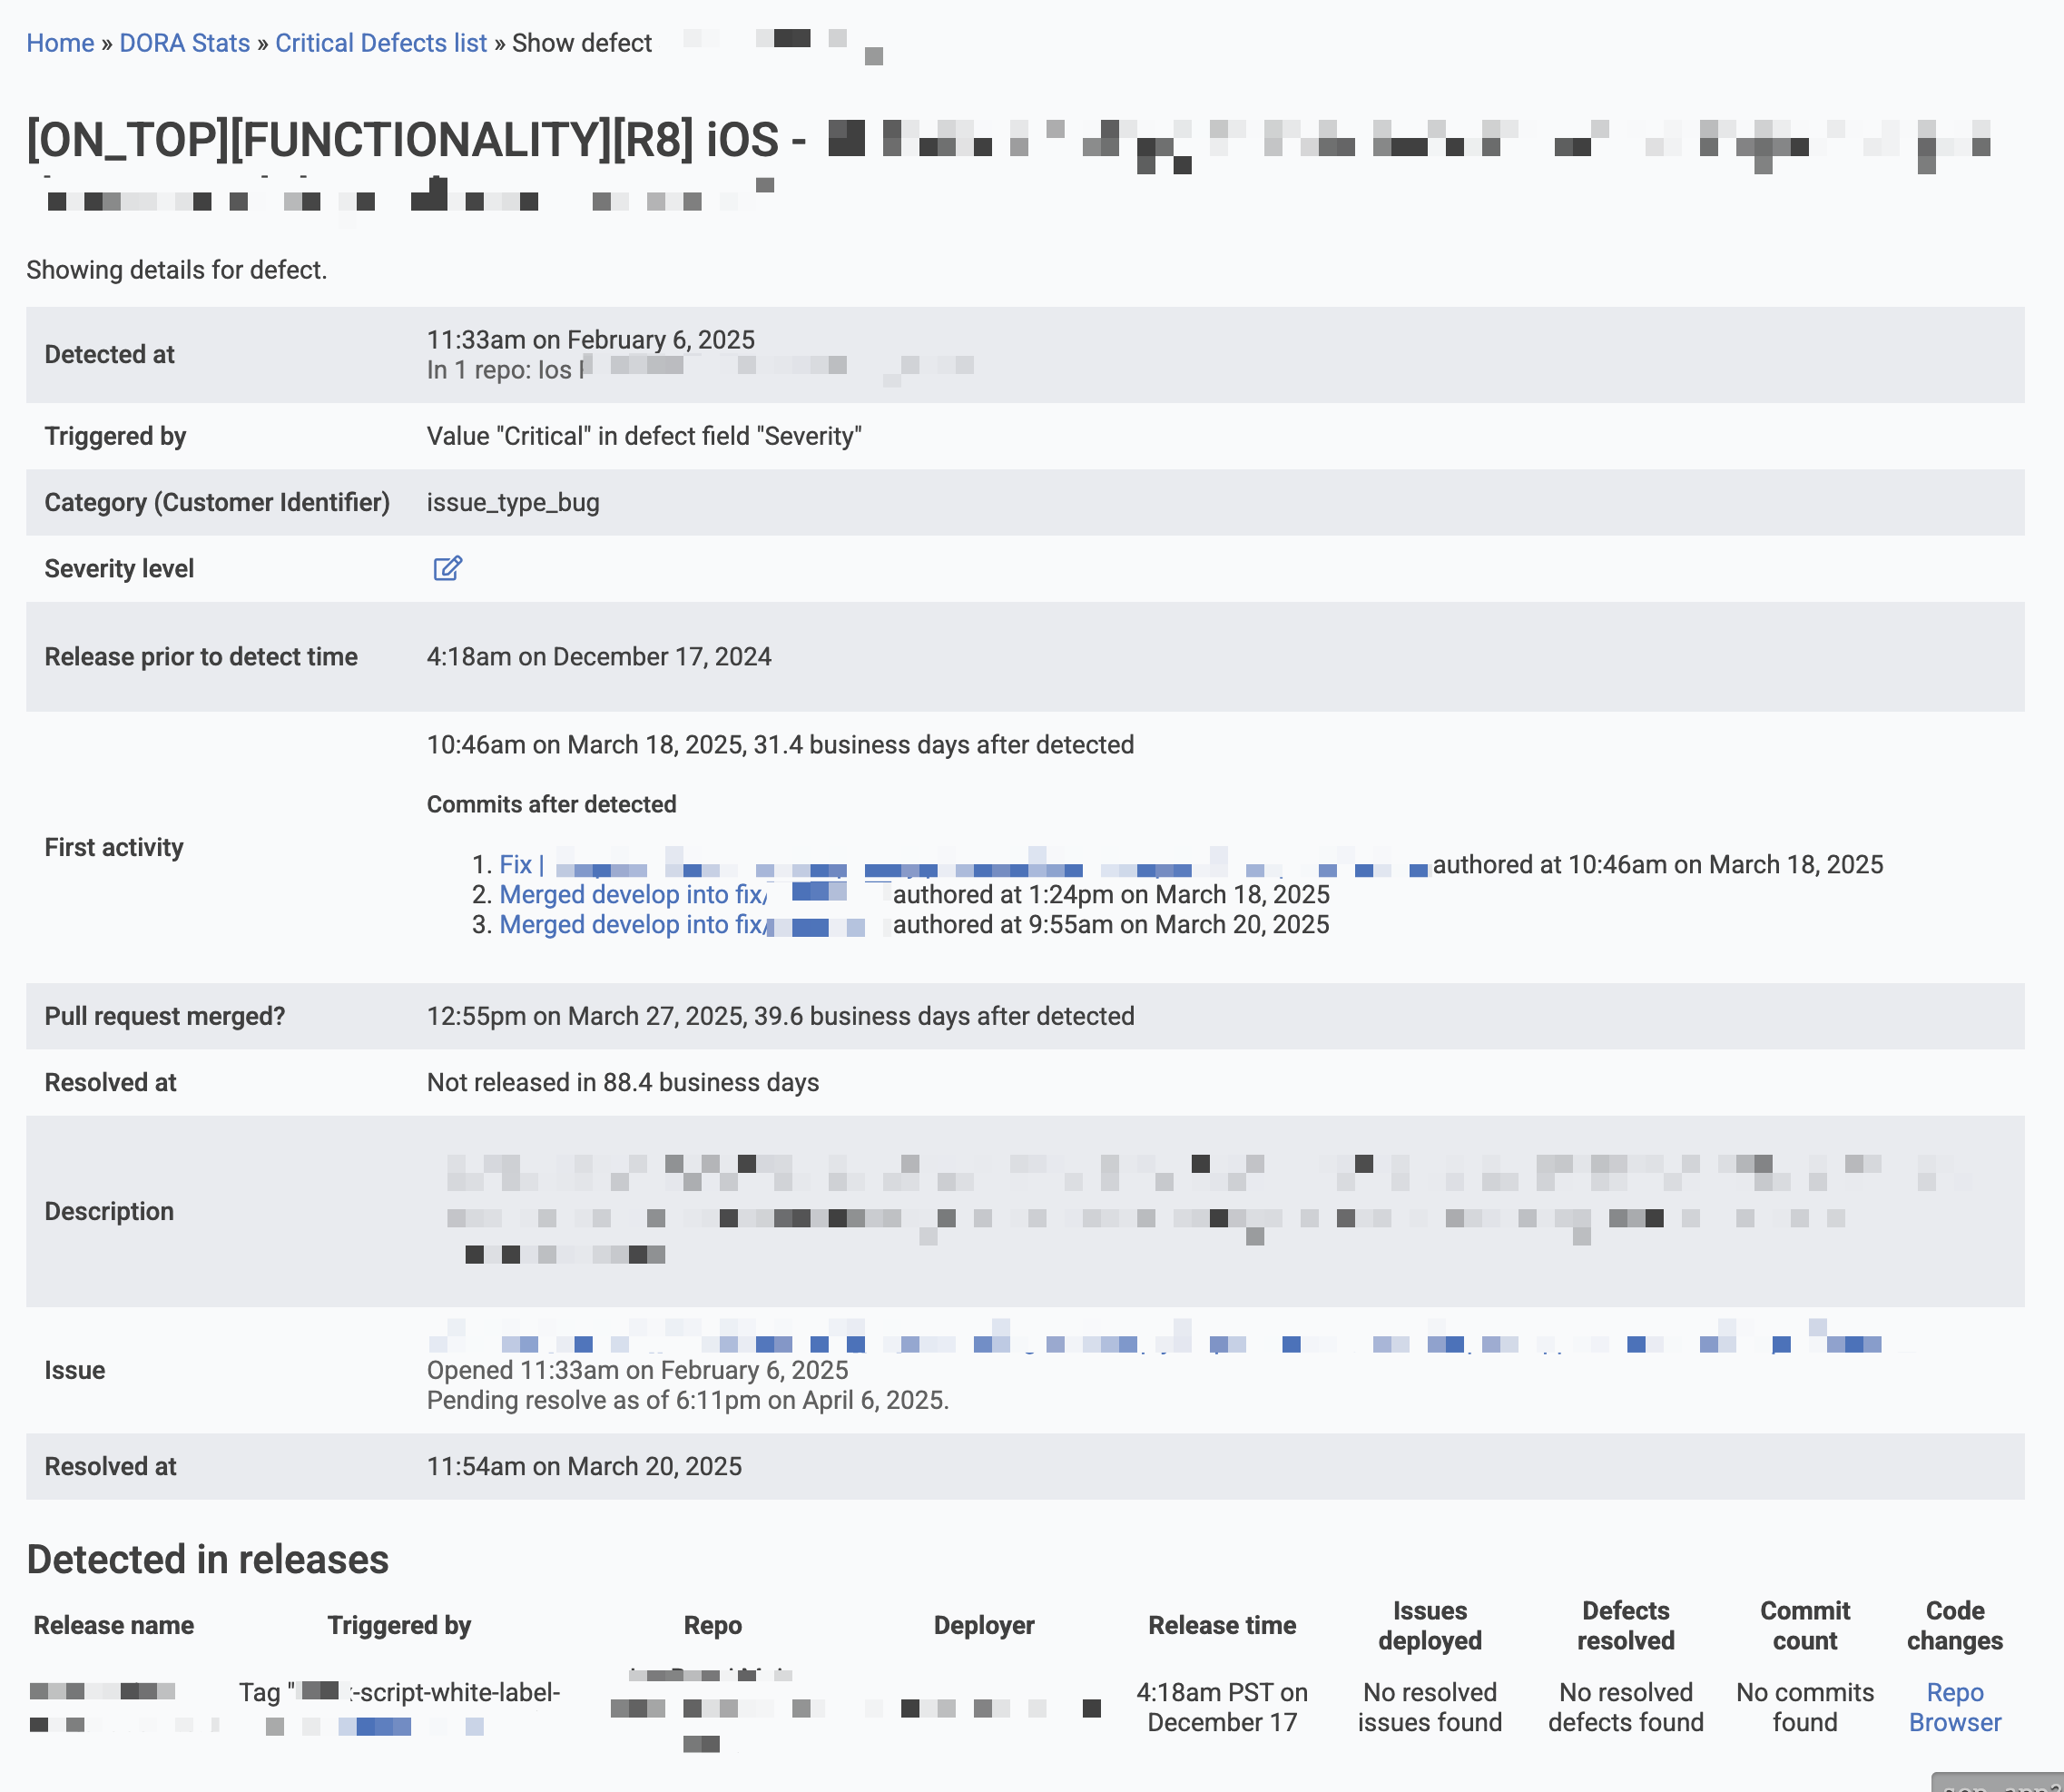
Specific details on a specific defect tell the full tale of its derivation
By allowing a defect view tantamount to a commit diff, DORA users are able to pinpoint down to minutes the full lifecycle of their defect pipeline.