The GitClear "Tech Debt Inspector" tool is built to sniff out where the tech debt is located within a repo. It will look something like this when visited under the top-level "Browse" tab:

Viewing a sorted list of high tech debt directories within the Facebook React repo with at least 5 hours of time spent in them
It is available in every repo for customers with an Elite or Enterprise plan.
linkWhat is tech debt?
The term "tech debt" is generally used to describe any code that developers work in that is disproportionately time-consuming to maintain, or prone to causing regressions when modified.
An apt real-world analogy for "tech debt" is "a house with an old roof." You can still live in the house, but the longer you do, the more it leaks and the more you're getting dripped on. You can usually put out cups catch the drips when it rains. But some days, you’re too busy to empty the cups and the carpet will get wet. The “roof” in this analogy is “tech debt.” It’s not inoperable, but every day you let it linger without addressing its deficiency, the problem gets a little bit worse, and it generally hampers your ability to focus on other priorities.
linkHow does Debt Inspector detect tech debt?
Every commit made to a repo in GitClear is evaluated across many dimensions, including "how much did this commit change the repo?" (i.e., its Diff Delta) and "how long did this commit take for its developer to author?"
Much like velocity in space is calculated by "distance traveled / time spent traveling," the velocity of code (its "Diff Delta velocity") is "amount of change / time spent changing." Files that cause developers to sink in a large investment of time to effect a small change will be calculated to have a low Diff Delta velocity.
For example, if Developer A spends one hour changing file bad/directory/main.cpp to beget 10 Diff Delta, then the Diff Delta velocity of the bad directory is "10 Diff Delta per hour." What's the Diff Delta velocity of bad/directory? If the only file in that path is the one we mentioned, then its velocity is also 10 Diff Delta per hour. However, Developer B changes a second file, bad/util.cpp to gain 100 Diff Delta in 30 minutes, then bad/directory would keep its 10 Diff Delta/hour velocity, whereas the bad directory would now have a Diff Delta velocity of (10 Delta + 100 Delta) / (1 hour + 0.5 hours) = 73 Diff Delta per hour.
linkDeciding which repos to inspect
The first challenge to locate tech debt is to choose which repo to inspect. When you click the "Browse" tab when an Organization or Entity is selected, you'll get a full list of repos as shown below. The most important detail to key in on is "Delta per hour," the rate at which developers are able to make changes within the repo:

Browsing repos within an entity, Web-Wrapper is the repo that looks to present the biggest challenge for developers to adapt
Another good data point to attend to is the overall amount of Diff Delta for the repo. Repos with a greater Diff Delta are those where more activity is happening, and so improvements to the debt in these repos can yield an outsized improvement to developer throughput.
linkInterpreting Debt Inspector

Using Tech Debt Inspector to view which directories evolve most slowly within the Facebook React repo
Tech Debt Inspector uses the same columns as the standard GitClear Directory Browser, but the calculation of those column values differs in one very important way.
In the standard Directory Browser, each directory shows the Diff Delta, Estimated Time Spent, and Diff Delta Velocity for files in the directory listed, plus files in all of its subdirectories. In the Tech Debt Inspector, the columns evaluate only files that reside directly within the specific directory listed -- not files that reside in any of its subdirectories. So, in the screenshot above, the script/enterprise folder is listed as the second highest tech debt folder, but that estimate would not include any work that occurred within a file like script/enterprise/anotherdirectory/whatever.py. That work would be accounted for in the script/enterprise/anotherdirectory directory.
linkFiltering with Debt Inspector
The Tech Debt Inspector uses a threshold of 60 minutes as the minimum time that must be spent in files in a directory for it to qualify to show in the Debt Inspector report. However, a CTO or VP of Engineering will often not be particularly concerned about directories that have only had an hour or two of work done in them over the past year. Usually, the directories that are having the biggest negative impact on a project's velocity are the directories that are being worked in every week. That's where the Tech Debt Inspector details help:

Filtering only slow-evolving directories where at least 5 hours of work has been undertaken recently
The "Min minutes" filter can help you narrow down only the directories that have had more than a given threshold of time used on them. Similarly, the "Min Delta" field can identify only directories that meet a minimum threshold of overall activity during the chosen time range.
linkGetting more details about slower-than-average work
Once you find a directory that you'd like to better understand, you can click on the directory to see which files within it are contributing to the low velocity

Clicking into a directory shows a list of specific files that are sluggish to change
Then you can click into a file to see how the file has been changing in size and complexity lately:
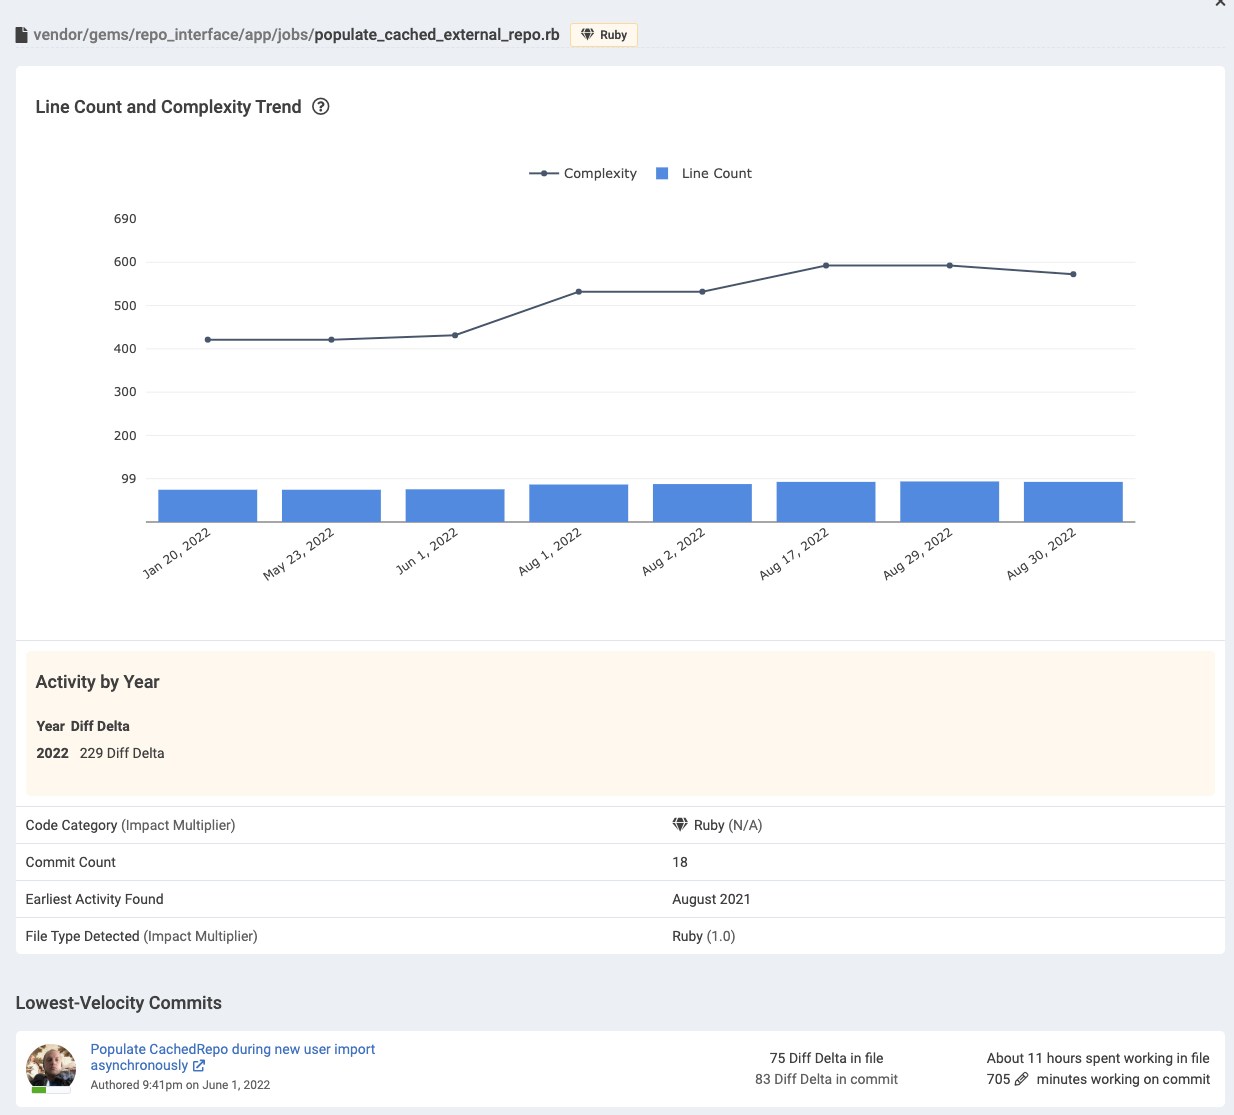
A file that has been growing rapidly in complexity
You see a commit that seems amiss (unreasonably low Diff Delta, or unreasonably high "Estimated Time Spent,") then any user with the permissions to edit Diff Delta or Estimated Time can click into the commit link and adjust those quantities so that a file or directory no longer gets a bad rap for being slow to evolve.
The graph of "lines of code" is fairly self-explanatory. "Complexity" is a measure akin to cyclomatic complexity: the deeper the nested logic in a file, the higher complexity (which approximates indentation depth) will climb.