Update: After compiling this data in late 2025, GitClear subsequently undertook a full-scale data dive to understand what quantifiable impact we could observe between "devs whose AI tooling proved they were highly active," and "how much durable code was authored?" |
Countless researchers have tried creative approaches to quantify "How much more code gets written with AI?" It makes the irony that much more delicious, seeing the top Google result to have bested all comers for "most authoritative answer to how much has AI changed developer productivity":
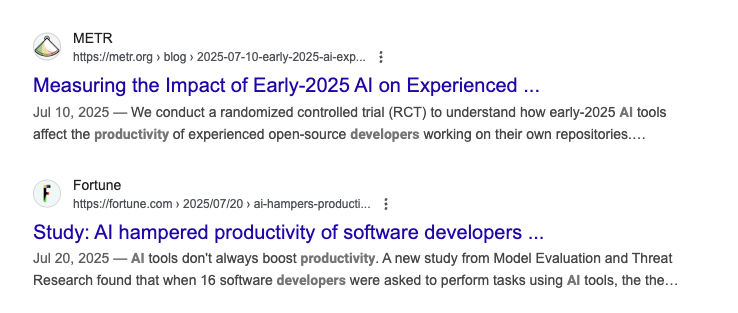
Top two Google results as of Q4 2025 for "How much has AI increased developer productivity."
The second result is just summarizing the first result, so the top two answers are both citing a METR study from 2025 that found developers, under the experiment's contrived conditions, became 19% less productive on a measured task when they had access to AI. It earned its way to the top with an eyebrow-raising proposition. But for those who entered the search term hoping to get a statistically significant answer, they can't love that, for the top two Google results combined:
linkPrior best sample: 16 programmers * 2 hours
The question of "how much more productive is AI making programmers?" is a frontrunner for "most important question of a generation." Certainly a most important question of the late 2020s. Placing all that consequence on a foundation of "less than 50 hours worth of observed developer activity"... is a lot to ask.
That's why we wanted to try a different approach: combining four years of "GitClear" and "GitHub" data, to look for patterns in a sample of developers who consistently author 500+ commits per year ("Professional" or "Semi-Professional" Developers). This sample offers a useful counterpoint, for those ascribe "signal" to "sample":
linkProposed sample: 75,000 developer-years
In this research, we will deploy GitClear & GitHub's terabytes of developer data to assess the quantifiable change in developer output since the debut of ChatGPT (November 2022). To read more about the data sources used to produce this analysis, see our Data Sources section below.
linkFour large-sample methods to quantify developer productivity change from 2022 to 2025
AI conveniently became available just as 2022 was expiring, staking it as a tidy anchor year from which to conduct analyses. The "natural experiment" this paper evaluates is whether any large, randomly sampled metric changed substantially between the experiment onset and today (2025)?
linkExecutive Summary: Blended Result
In the sections that follow, we will describe the methodology used to derive the chart in this section. But this section is for the "tl;dr crowd," who are breezing by to collect a data point.
For technical-minded executives who need to make decisions based on data, there is plenty of incentive to read on to understand the exact method by which we arrived at this estimate. The one paragraph version goes something like:
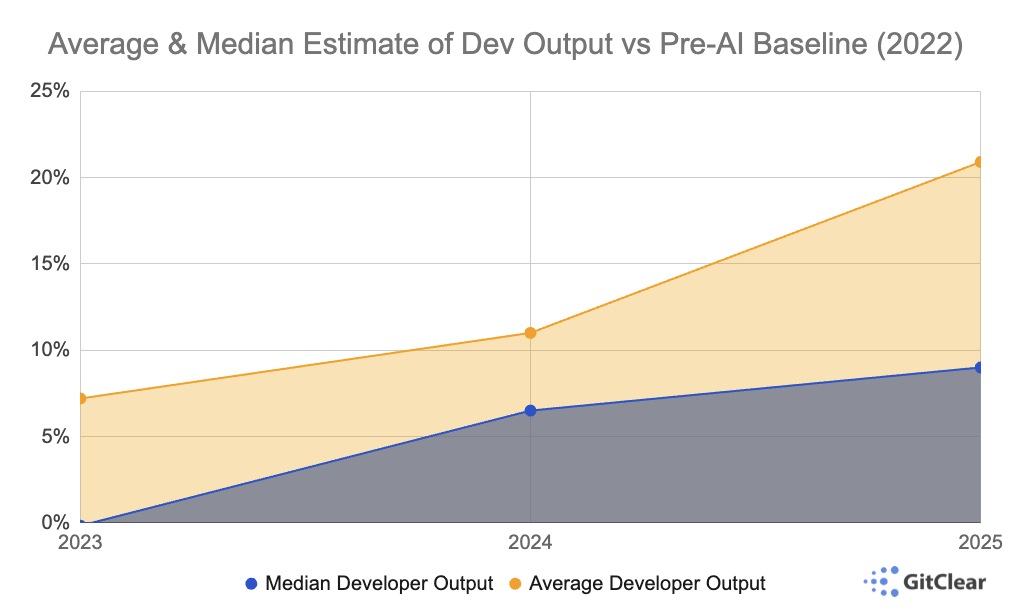
We analyzed about 75,000 years of developer commit counts, limiting our study criteria to only "developers who recorded 500+ commits every year between 2022 and 2025." We looked at how these developers' annual Commit Counts had changed per-year, both collectively (Method #1) and individually (Method #2). Then we averaged these two percentage changes with Diff Delta, a measurement of durable code change that GitClear calculates by stripping away the ~97% of code change lines that don't matter. The average of these three methods is what is graphed above. In terms of exact data points:
Year | Average Dev Output | Median Dev Output |
2022 | Baseline (N/A) | Baseline (N/A) |
2023 | 7.2% | 0% |
2024 | 11.0% | 6.5% |
2025 | 20.9% | 9.0% |
linkResearch on AI Usage
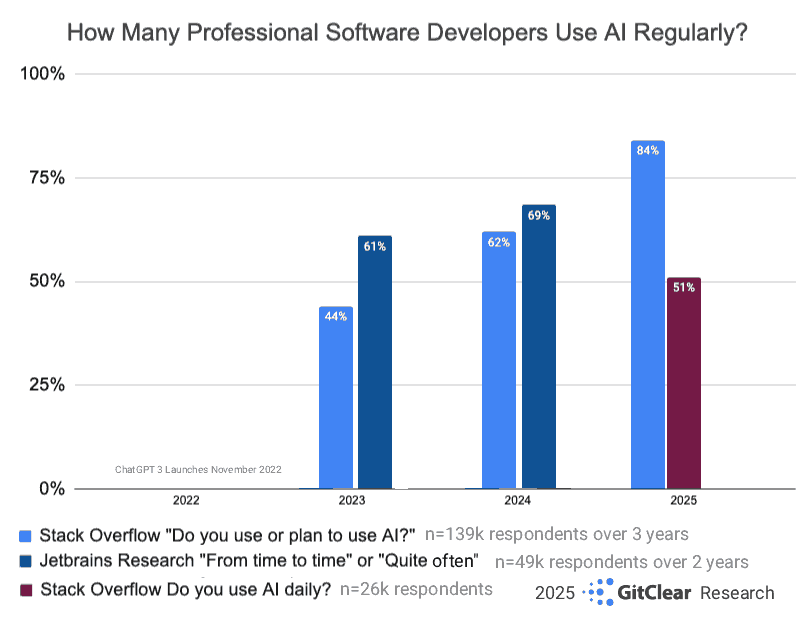
84% of Developers "use AI or plan to" in 2025. Half of Developers use it daily
The "51% daily use" figure suggests that "changes from AI" won't be evenly distributed.
The median developer is on the cusp of using AI Tools daily, so their AI-influenced output figures to be little-changed. To whatever extent (positive or negative) AI impacts developer metrics, it seems likely to be concentrated in the 20% "most avid" users, which is ~10% of the overall developer pool.
It is unwise to assume that the 90th percentile of "highest output programmer" coincides with the 90th percentile of "active AI use." This paper won't measure that directly (subscribe to updates to receive a paper that will analyze that question directly, later in Q4).
For this research, four methods will be used to analyze 70,000 developer-years worth of GitHub "Commit Count" data. We'll also assess thousands more developer-years, focusing on "Net Lines Added" and "Volume of Meaningful Code Changes" (Diff Delta).
linkMethod #1: Professional Developers active every year from 2022-2025
This method looks at the average and median number of commits per year among developers who recorded 500 or more commits each year from 2022 (the "baseline" condition) through 2025 (approximately 50% of developers use AI daily). Developer user names that end in "bot" were excluded from the analysis, so this data focuses specifically on how human output, assisted by AI tools.
Year | Average Commit Count | Median Commit Count | |
2022 | 1,538 | 1,162 | 17,341 |
2023 | 1,673 | 1,242 | 17,341 |
2024 | 1,680 | 1,235 | 17,341 |
2025 [1] | 2,062 | 1,241 | 17,341 |
[1] The "Commit Count" number for 2025 was measured by taking the previous year of activity from the date at which this research was undertaken: September/October of 2025. The 2025 measurement still includes exactly 365 days. The "start date" for the 2025 data thus begins in September/October of 2024, one year prior to the date at which the Commit Count was recorded for this research.
Analyzing each year as a percentage change, compared to the 2022 baseline of "Average" (1,538) and "Median" (1,162) commits:
Year | Average Commit Count v Baseline | Median Commit Count v Baseline |
2023 | ||
2024 | ||
2025 |
Among all developers who maintained a Professional Developer's pace of 500+ commits yearly, the median developer ended up not far from where they started. However, the average developer was able to grow their annual Commit Count by 34.1% This implies that developers in the top percentiles of output increased their Commit Count by a substantial margin compared to their 2022 performance. This trend is especially apparent in our Method 2 results.
linkMethod #2: Professional Developers compared to their 2022 baseline
As with Method #1, this method analyzes 17,341 developers who authored at least 500 commits during every year between 2022 and 2025. Unlike the first method, this analysis assesses the average and median change per year, relative to that same developer's 2022 baseline for "Commit Count."
That is, whereas the first method looks at each year's "Commit Count" values in aggregate, this method looks at each year's "Commit Count" value relative to the same developer's 2022 Commit Count. To calculate the "average" and "median," we produced a long array of "percent change vs 2022" by year. That array is then statistically analyzed to produce these "average" and "median" values:
Year | Average Per-Dev % Change | Median Per-Dev % Change |
2023 | +22.3% | +5.2% |
2024 | +28.9% | +4.8% |
2025 | +49.5% | +6.1% |
Interesting to see how the average increases substantially, while the median developer is only incrementally higher.
In other words, this method implies that "the rich are getting richer" when it comes to developer output. Those top percentiles of Developers -- the ones who aspire to churn out the highest possible volume of commits -- have succeeded in doing so far beyond the 50th percentile developer, whose increase in Commit Count was only 6% higher than 2022.
These findings suggest that, if you were to ask a randomly sampled developer "how much more productive have AI tools made you?" the answer would tend to be "not much." If you asked a developer who oriented their career around utilizing the latest methods & tools to boost their productivity, you would find a number of them that have succeeded in doubling their output, as measured by this metric. GitClear's previous research suggests that "Commit Count" correlates with "Story Points" (developer energy) at a rate close to 30%.
linkMethod #3: Active Diff Delta by Developers with 500+ commits
Now we turn to GitClear's analysis of the difference in meaningfully changed code lines. In past research, it has been shown to correlate with Story Points (proxy for developer effort) slightly better than "Commit Count." Does this independently calculated metric corroborate the narrative we've seen in methods #1 and #2, that the median developer has increased their output by around 10% since 2022?
Year | Annual Average Delta | Annual Median Delta | Developer Sample Size |
2022 | 49,319 | 40,140 | 132 |
2023 | 46,432 | 35,090 | 153 |
2024 | 49,464 | 43,510 | 222 |
2025 | 52,318 | 45,799 | 286 |
Which translates to annual measurement vs baseline:
Analyzing the amount of meaningful code change as quantified by Diff Delta, we ultimately find a similar increase to what was measured by Commit Count. By 2025, the "average" and "median" developer authored 5-15% more code than they had in 2022. Intriguingly, this method of data analysis does not show the same 2023 increase that Commit Count did. It suggests that, while developers were quick to decipher how they could churn out more code, it took longer for the tools to reach the point that the "extra code generated" was not discarded quickly after being authored.
This suggests that, as the years have passed, the tools have slowly become more adept at providing durable code that can last beyond the perfunctory review of the team's Senior Developers.
linkMethod #4: Lines of Code Added per Developer
For our final gauge of how developer output is changing, we analyzed the number of code lines added (not moved, not find/replaced, or other "faux additions") per developer. Here is a look at how much more code is being added each month by developers:
Year | Average Lines Added | Median Lines Added | Developer Sample Size |
2022 | 1,314 | 921 | 655 |
2023 | 2,047 | 1,029 | 2,045 |
2024 | 2,126 | 1,097 | 2,708 |
2025 | 3,037 | 1,624 | 3,162 |
The annual change vs a 2022 baseline is thus:
Year | Average vs Baseline | Median vs Baseline |
2023 | ||
2024 | ||
2025 |
Compared to "Commit Count" and "Diff Delta," the change in "Lines Added" has far outpaced other types of measurable changes to developer output. This corresponds with GitClear's previous research on AI Code Quality: while AI tools are undoubtedly increasing developer output, the quality of code fueling the measured velocity increase is dubious.
linkConclusion: 10% Productivity Gain looks real, but so are costs
When amassing large-scale data to substantiate how AI has changed developer output, the data confirm an upward trend. However, that "upward trend" applies as-much-or-more to the metrics that quantify "how much code will the team need to maintain?" as it does "how much output will each developer gain?"
For the Commit Count-based metrics, we find a substantially higher jump in "average" value than "median" value. Since many enterprise workplaces were initially reluctant to even allow AI use, the change in developer output has been a gradual one, excluding the (generally undesirable) change in "Lines Added" and "Lines Copy/Pasted":
Zooming out to put these numbers in context, they align closely with the productivity delta cited by Google's CEO, Sundar Pichai, during a 2025 podcast with Lex Fridman,
"The most important metric, and we carefully measure it is: how much has our engineering velocity increased as a company due to AI? It’s tough measure, and we rigorously try to measure it, and our estimates are that number is now at 10%."
If one takes the average productivity change of the 50th percentile developer across Method #1, #2 and #3 (6.8%, 6.1%, 14.1%, respectively), it produces an average change of +9.0% -- about one percent shy of what Pichai estimated during his conversation with Fridman.
Quantifying developer productivity in 2025, relative to 2022, engineering leaders have fodder for either a "bullish" or "cautious" narrative.
The bullish narrative is that Method #2 proves the existence of a substantial cohort of professional developers that are now making commits at double the rate they could muster in 2022. How substantial? Before we reveal the answer, try to guess: What percentage of developers in the sample made at least 2x as many commits in 2025 than they did in 2022? Here is the answer. And how many made fewer commits in 2025 than they did in 2022? Here is that answer. Much like above, the median developer wasn't that much different in 2025 than 2022. But the 85th percentile developer authored 2x as much work this year than in the final pre-AI year.
The bearish narrative is that implied by the second half of the "bullish" one: about half of developers in our sample authored the same or fewer commits in 2025 than they did in 2022. By no means is there a ubiquitous explosion of productivity. Furthermore, even among those that have succeeded in juicing their commit count, they are almost certainly doing so at the expense of authoring code that is well-integrated with the project's prior methods & conventions. The amount of "Added" code in 2025 increased by so much it got cut off on the "Change in Output" graph. GitClear's previous code quality research has shown that 2024 was the first-ever year where "Copy/pasted" code was more prevalent than "Moved/reused" code.
There might be nothing more dispiriting to a developer than to be making rapid progress on a ticket, when they suddenly discover that there are 3 similar methods that implement some function that they need to utilize. These cases are growing more common as executives chase the "AI productivity multiplier" effect that they read about from Sam Altman and others. While AI improves every year, it is still a long way from being able to fit the full context of a 100,000+ line repo into its context window. Until that happens, any coding task that needs to adhere with existing conventions, and reuse existing project methods, is going to frustrate the developers that have to maintain that "double productivity" code in the years to come.
It has never been more vital for technology executives to educate themselves on how to reap the quantifiable benefits from the powerful tools now available. Just as it is twice as fast to manufacture a skyscraper absent building codes, a pragmatic tact is essential to prevent today's productivity surge from evolving into tomorrow's dilapidated heap of uninhabitable mess.
linkData sources: Methods applied, code used for analysis
This section will describe the methodology and sources that were used to produce the preceding data.
The intent here is to allow transparency to compensate for any shortcomings that may exist in the analysis methods. We have made an earnest effort to produce unbiased data, guided by the intent to:
Formulate methods that can show developer productivity / durable code output either increasing or decreasing by year
Include as many developer stats as can be produced from our data sources
Utilize recommendations from LLMs in how to analyze this data with as few confounding factors as possible
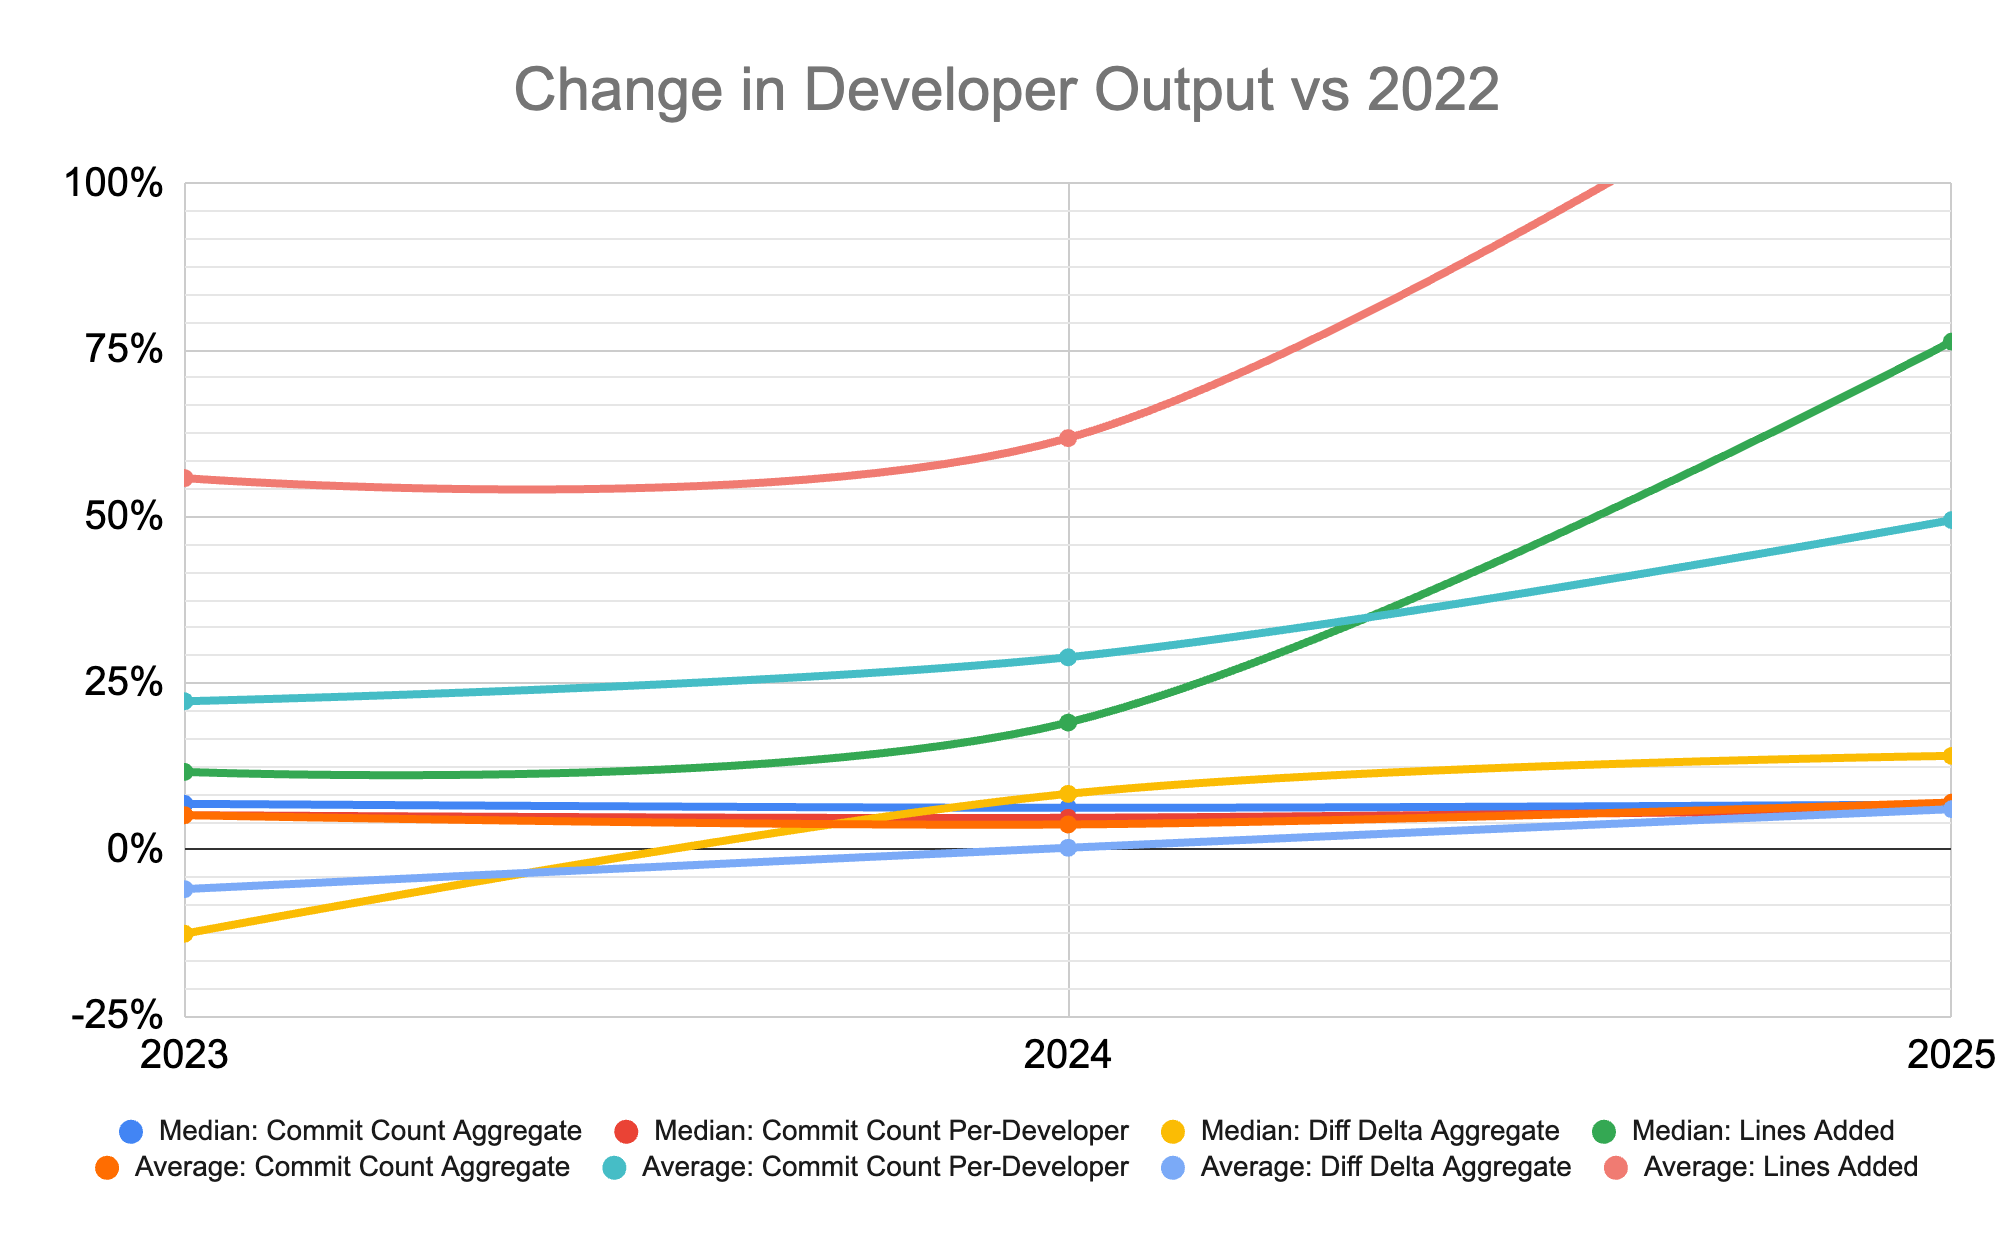
The raw data used to generate the "Change in Developer Output" chart was extracted from each of the "Method" sections, comparing the metric in question vs its 2022 value.
linkChange in median output vs 2022
Year | Method 1 Commit Count | Method 2 Commit Count | Diff Delta | Lines Added |
2023 | +6.9% | +5.2% | -12.6% | +11.7% |
2024 | +6.3% | +4.8% | +8.4% | +19.1% |
2025 | +6.8% | +6.1% | +14.1% | +76.3% |
By far, the largest change in median developer output has been to the number of lines added.
linkChange in average output vs 2022
Year | Method 1 Commit Count | Method 2 Commit Count | Diff Delta | Lines Added |
2023 | +5.2% | +22.3% | -5.9% | +55.8% |
2024 | +3.8% | +28.9% | +0.3% | +61.8% |
2025 | +7.1% | +49.5% | +6.1% | +131.1% |
The "Commit Count" data was collected by taking publicly available data from Github profiles, which allow for extracting either the count of commits in a calendar year, or in the case of 2025 (which is 3 months from concluding at the time this research is being authored), take the count of commits from September 2024 through September 2025.
The "Diff Delta" and "Lines Added" stats were extracted from GitClear's own database, which blends large open source projects from Microsoft, Google, and Amazon, with that of small and large private companies that have opted into sharing anonymized data.
linkMethod analyses code & queries utilized
Included below are the queries that were used to produce the data shown in each of the data sections.
linkMethod #1 Analysis: Queries used
linkMethod #2 Analysis: Queries used
Reused method to collect applicable developer IDs: those with 500+ commits per year: See step 1 from "Cohort method 1" above
linkMethod #3 Analysis: Queries used
For this analysis, we took all committers that registered at least 500 commits per year, subtracted by those without adequate activity in the first month of the year (to exclude devs whose full year might not have been processed), and took the annual average and median for those developers.
Ruby code used to produce data.
linkMethod #4 Analysis: Data sheet used
For this analysis, we queried all months since 2022 where a developer had authored 50 or more commits. For all such months, we output an array of the number of lines added per-developer, and pasted them into this spreadsheet. Our cutoff for "valid data" was any record with 10 or more added lines (there were around 5% of developers who authored 50 commits in a month without having recorded 10 lines added). Among these line counts, we calculated the "average" and "median" using Google Sheets' built in methods to derive these statistics from an array of numeric input.
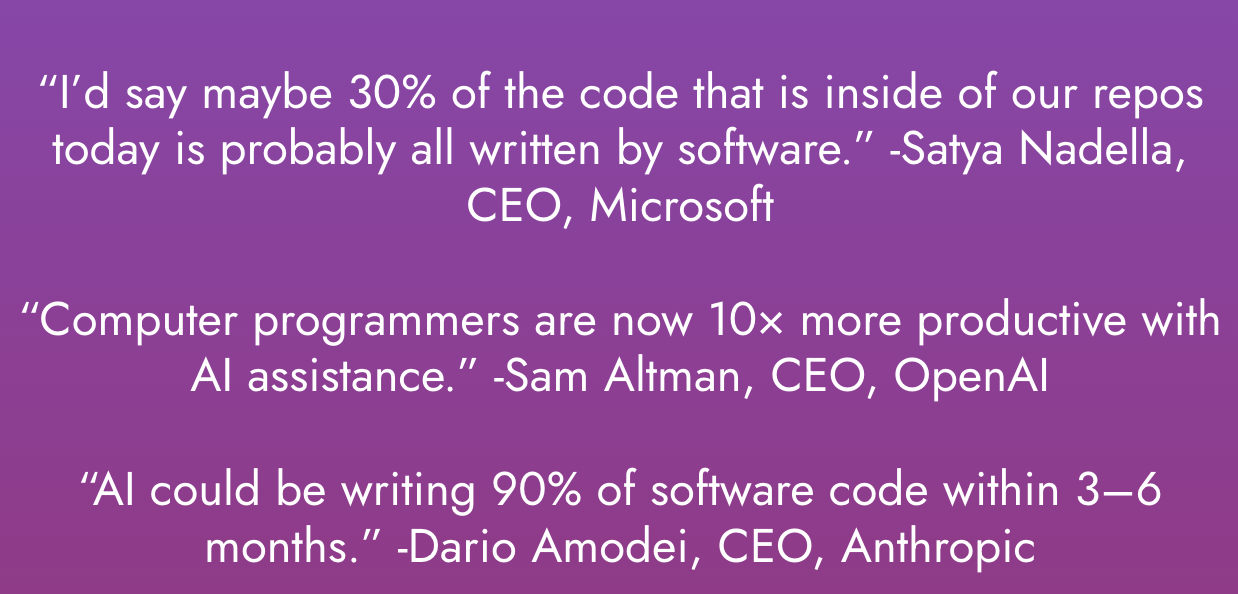
linkQuotes from AI CEOs on the impact of AI tools