Google DORA ("DevOps Research and Assessment") is a set of software metrics and benchmarks that can be used to categorize an organization's DevOps performance from "Low" to "Elite." Started by a team of software researchers in 2014, DORA was originally a research firm that produced annual reports titled "State of DevOps" (ex: 2018 State of Devops). Research conducted by the team between 2014 and 2018 was subsequently coalesced to author what would become the canonical text on high-performing DevOps, Accelerate. Shortly after publishing Accelerate, in late 2018, the DORA team was acquired by Google.
linkWhy DORA?
What is it about the DORA metrics that has captured the attention of Google and thousands of other software businesses? We observe three key reasons that DORA gets chosen over other software metrics:
Founded from years of research. DORA's credibility starts with the academic background of its Founders. From the description of Accelerate on Amazon: "Through four years of groundbreaking research from the State of DevOps reports, Dr. Nicole Forsgren, Jez Humble, and Gene Kim measure software delivery performance―and what drives it―using rigorous statistical methods."
Correlated with Enterprise success. Metrics like "Availability" and "Deploy Frequency" might be less important to a startup than the raw speed at which their repo is evolving. But for larger companies, prone to getting mired in bureaucracy, ensuring that their software continues to be released frequently is of paramount importance.
Specific benchmarks to gauge performance. Possessing a set of specific, highly-researched numbers allows companies to categorize their performance as "Low," "Medium," "High" or "Elite." Other software metrics (e.g., "Lines of code" or "Commit count") are too variable between companies to assign a value for what constitutes "Low" or "Elite" performance.
linkIs Your Team's Performance Low, Medium, High, or Elite?
The payoff for almost 10 years of research on comparative DevOps performance? A trove of benchmarked stats, allowing any company to assess how their DevOps performance compares to industry leaders:
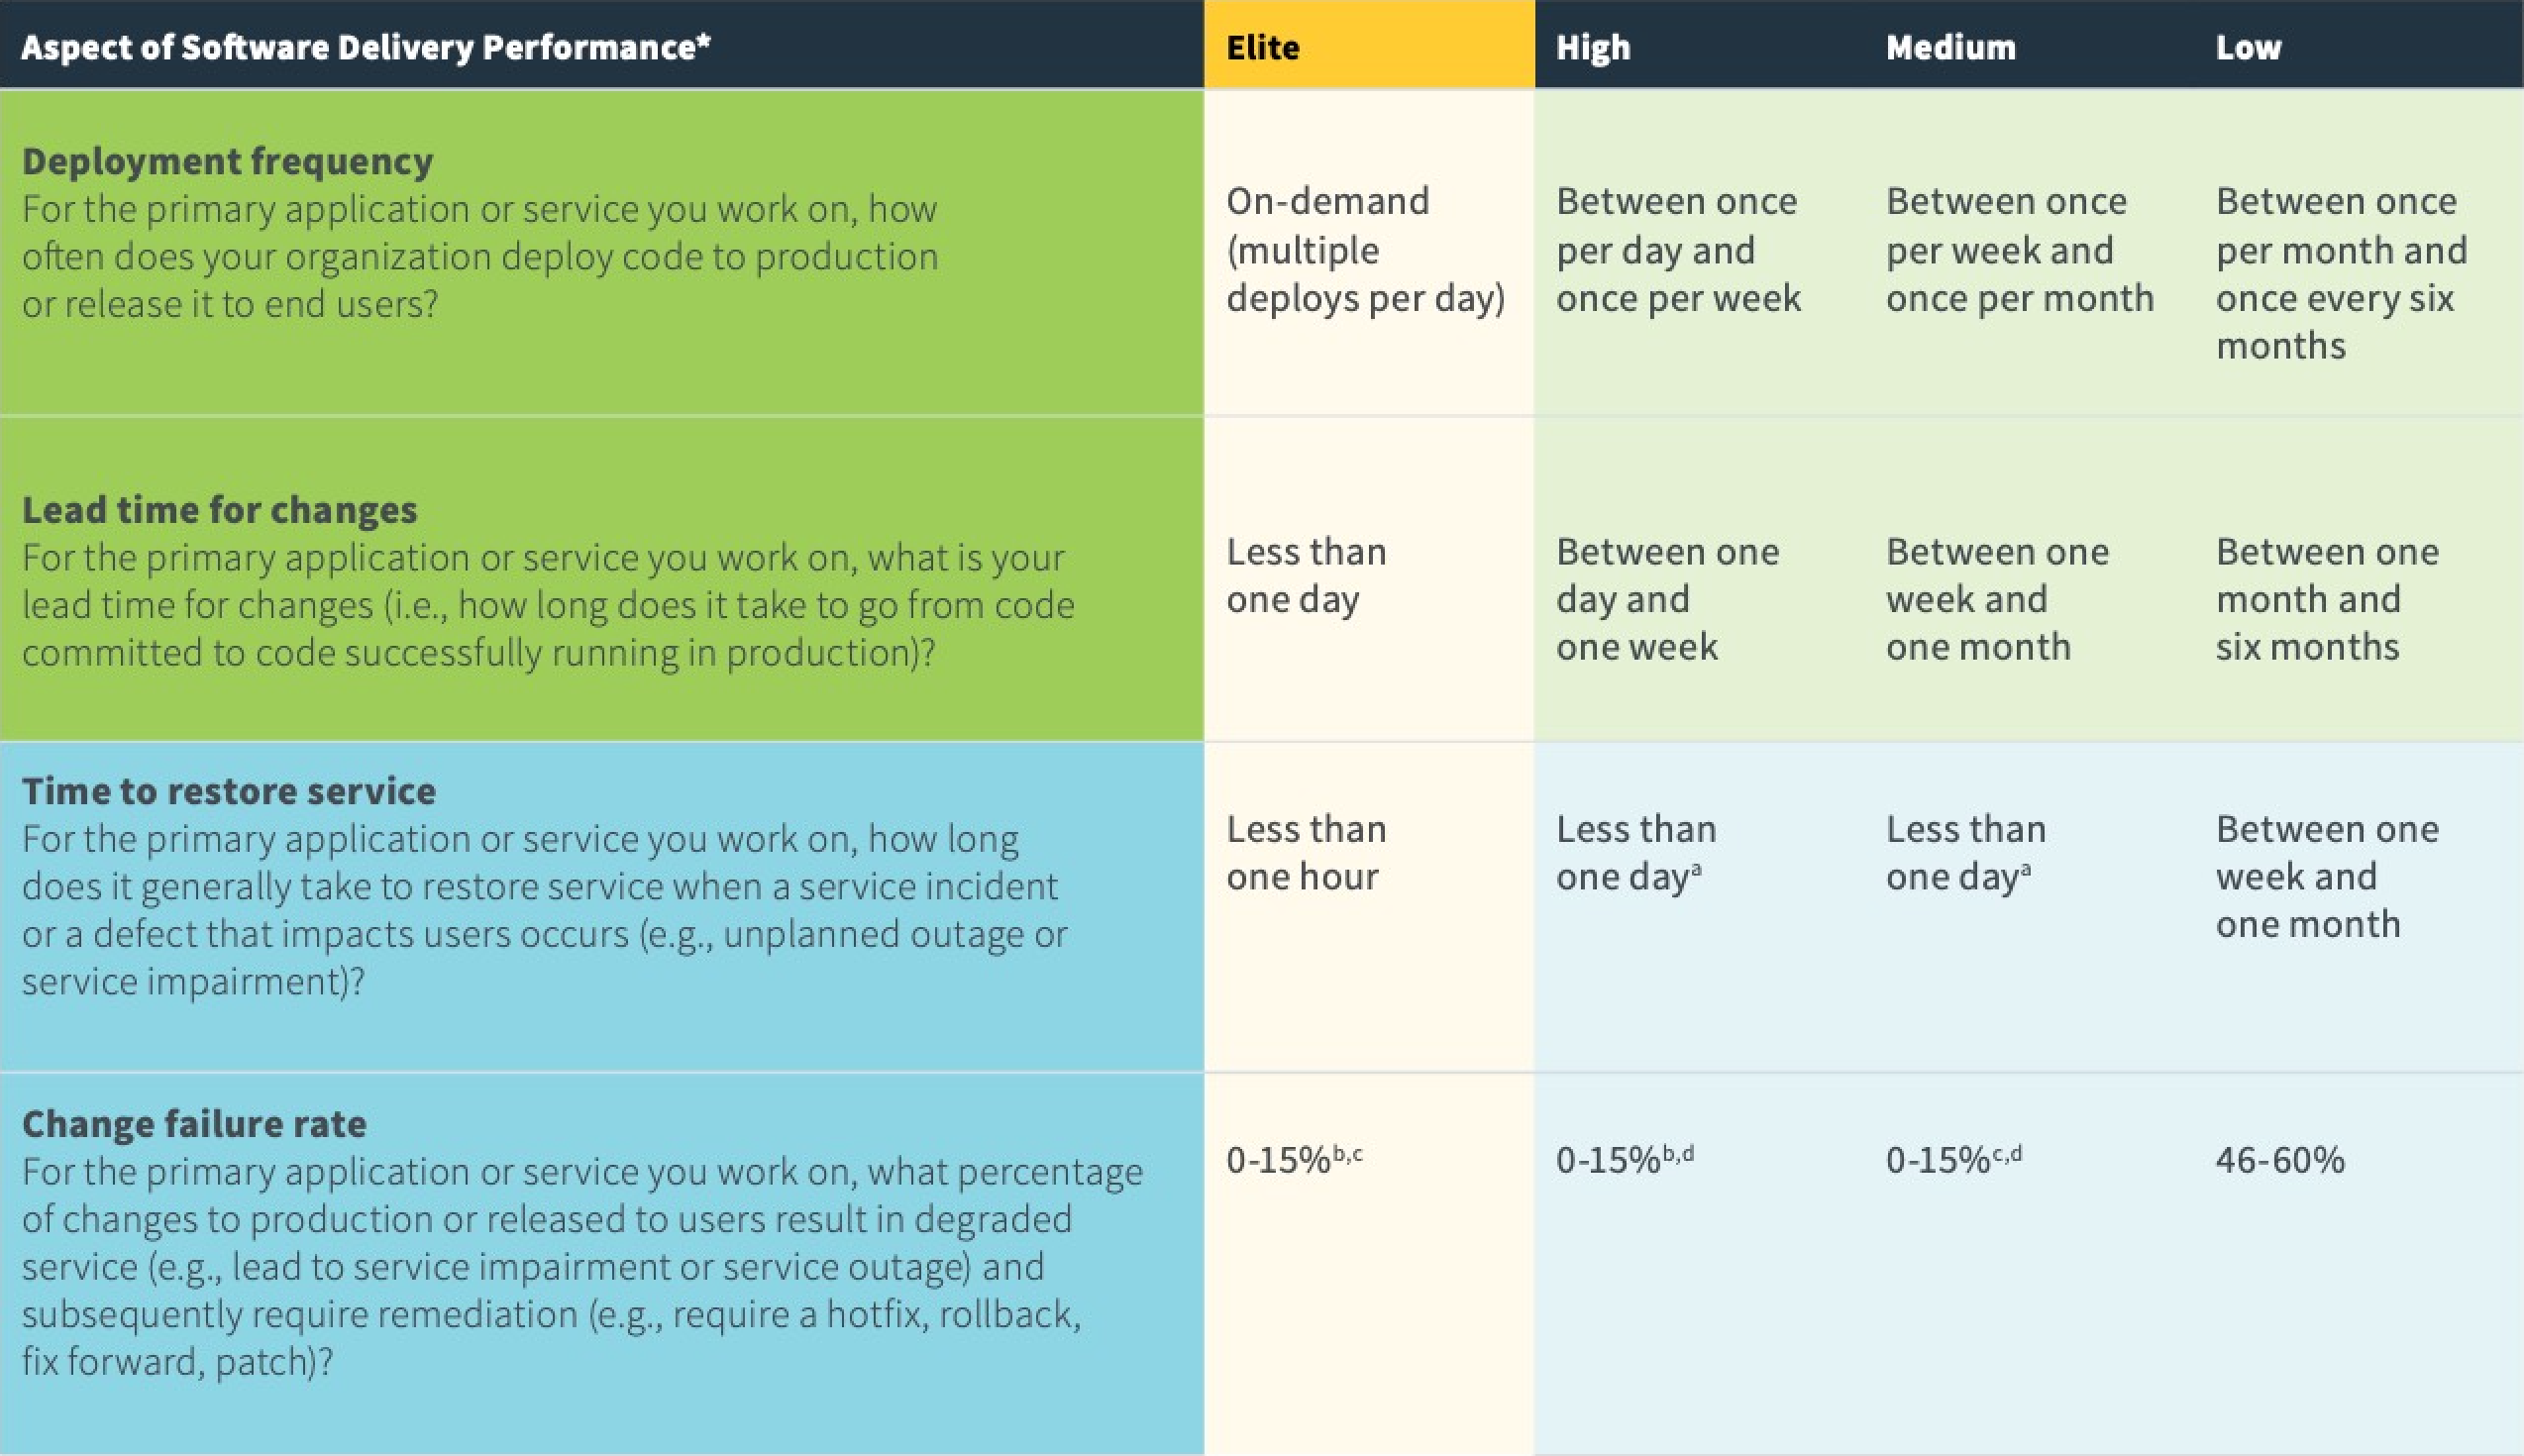
Details from Google on the four critical DevOps metrics show various performance thresholds as they stood in 2020 and 2022
One interesting wrinkle in the DORA stats is how they re-measure these benchmarks from year-to-year. As you can see in the tables below, 2020 and 2022 yielded identical benchmarks, while 2021 was the odd duck, especially for "Low" performance measurement. 2022 did not publish an "Elite" tier, but since their "Low" and "High" tiers matched, it seems reasonable to infer that the Elite tier is probably about what it had been?
link"High" Performance by Year
Metric | 2020 | 2021 | 2022 |
Deployment frequency | Multiple per day | Multiple per day | Multiple per day |
Lead time for changes | One day to one week | One day to one week | One day to one week |
Time to restore service | Less than one day | Less than one day | Less than one day |
Change failure rate | 0-15% | 16-30% | 0-15% |
Let it not be said that Google will be thorough in their measurement, even if it means deriving the same values every year.
link"Low" Performance by Year
Metric | 2020 | 2021 | 2022 |
Deployment frequency | 1-6 months | Less than once per 6 months | 1-6 months |
Lead time for changes | 1-6 months | More than six months | 1-6 months |
Time to restore service | 1 week to 1 month | More than six months | 1 week to 1 month |
Change failure rate | 46-60% | 16-30% | 46-60% |
Guess that whoever did the benchmarking in 2021 got fired? 😂
linkThe Four Pillars of DORA
While Google and the DORA team reevaluate their metrics and benchmarks each year, for several years they have settled on the same four metrics as the basis for high performing DevOps teams: Deployment Frequency, Lead Time for Changes, Time to Restore Service, and Change Failure Rate. This section will delve into the definition for each, and how a team can benchmark its own performance.
link🚢 Deployment Frequency
The first stat they recommend tracking and optimizing is “release frequency.” Google considers this the most fundamental metric, as “releases” or “deployments” are the underpinning of all four DORA metrics. This makes sense — if you are not shipping code to production regularly, improving that opens the door to faster cycle time and repair time.
According to Google’s benchmarking, an Elite team will make a release of their product "On demand," or at least once per day.
linkSetting up release tracking on GitClear
Our Release tracking setup page describes your options for tracking the frequency of your repo releases. The short version is that you can designate a release by any of 1) a regular expression match of a commit message 2) a push to a release branch 3) a post to the GitClear API endpoint.
linkInterpreting your GitClear “Release Frequency” measurement
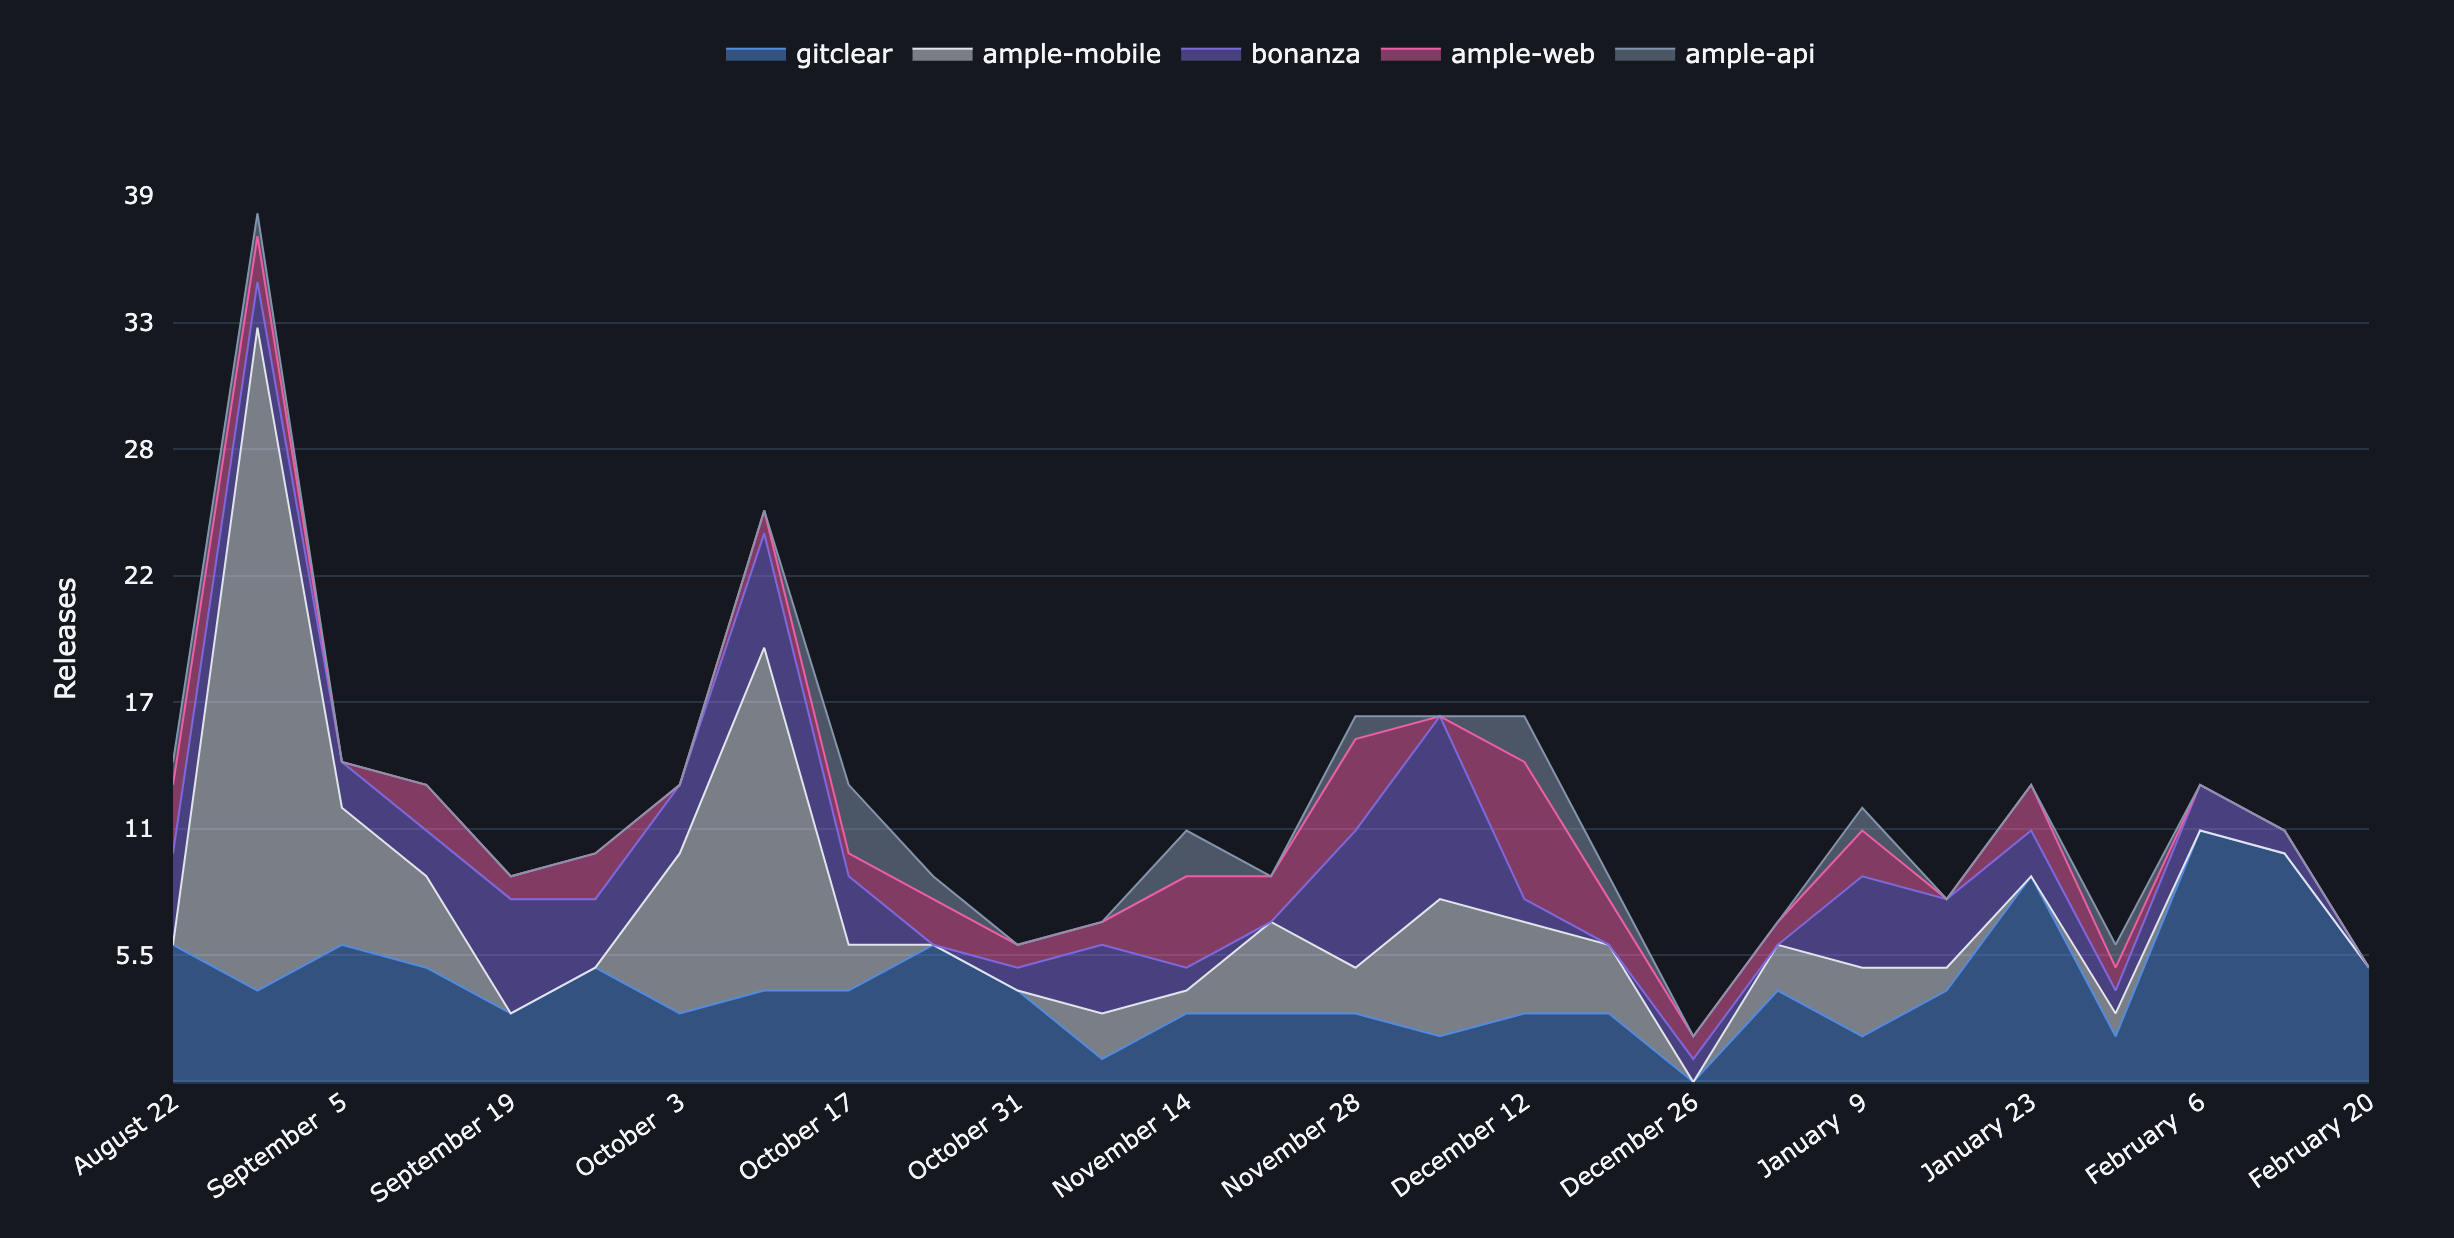
Viewing releases segmented by repo over a period of 6 months
In terms of applying Google’s release frequency benchmark to your own real world team, one must start by interpreting what constitutes a “product” or “business unit,” since companies vary widely on how many repos, projects, and team members they are grouped into. Our recommendation for simplicity is to strive to make one release per day per team. GitClear is set up to allow grouping developers, managers, and leaders/executives so it matches how employees work together in the company.
When you view Release Frequency on the Release Velocity page, you will see it grouped by team. This makes it straightforward to check the cadence of releases per functional team at the company.
link⏩ Lead Time for Changes
How many business days does the team average between when the first commit referencing an issue is authored, and the final work on the issue is released to production? Top performing teams can complete this process in less than one day.
linkSetting up Time to Release on GitClear
To track “Time to Release,” you must set up Release Tracking setup and Issue Tracking. Once these have been configured, we will automatically begin to calculate the business time that has elapsed between the initial authorship of a commit, and when that commit was last released.
linkInterpreting your GitClear “Time to Release” measurement

View Release Cycle Time over a chosen interval from the "Velocity" tab
Time to Release is calculated in days, and considers only the “business hours” of the committer that is working on it. For example, if a developer from your team begins work on an issue at 12pm in their time zone, and a final release of that work takes place at 9pm the same day, we would calculate that issue as having a Time to Release of 0.6 days, reflecting that 5 business hours passed between when the developer began work on the commit and when that work was released (after business hours, relative to the time zone of the developer that did the work).
link🐛 Change Failure Rate
This metric captures the percentage of all releases that included a defect that was later deemed “critical” or “substantive.” The highest performing teams will have critical defects found in less than 15% of their releases. A sampling of the strategies that can be used to reduce defect releases:
Thorough testing: preferably automated, but otherwise via QA. The best case outcome when a defect is introduced is that it will be found before a product release puts it in the hands of customers. A robust testing strategy is the key to getting bugs detected promptly, before a release occurs.
More frequent releases. The more time passes between releases, the more difficult it becomes to prove that there won’t be an undetected failure in how newly added systems interact.
What gets measured improves. 🙂 The act of simply making your defect release percentage transparent is a first step toward improving it.
linkSetting up Defect Release Percentage tracking on GitClear
There are two components to tracking defect release percentage. The first is tracking your release, which can be set up following the instructions on our Release Tracking setup page. The second is tracking when critical defects occur, which can be set up following the instructions on our Critical Defect Tracking setup page.
linkInterpreting your GitClear “Defect Release Percentage” measurement
GitClear offers two options to record when a critical defect has occurred. The default option is via your issue tracker (Jira and GitHub issues currently supported). In your Issue Tracker Project settings, you can specify one or more issue tracker fields that demarcate a critical defect. By default, if you are connected to Jira and you have a. “Highest” value for your “Priority” field, we will interpret that as a critical defect. Also, if you have another field whose values contains “Critical” (e.g., a “Labels” field), that will be automatically detected as a critical defect.
If you have other conventions for designating a critical defect, you can specify this in the Issue Tracker Project settings.
The second option to designate a critical defect is to make a call to the GitClear API. Please email support@gitclear.com if you would like to receive instructions on submitting critical defects via a RESTful API call.
The “Defect Release Percentage” that we show in the “Issues & Defects” tab shows what percentage of releases have subsequently had a critical defect detected in them. Note that a critical defect can span multiple repos (for example an “API” repo and a “front-end” repo), so if two repos made releases that contained the same critical defect, that will count as two defects released from the standpoint of the “Defect Release Percentage” calculation.
link🏥 Time to Restore Service (MTTR)
How many days does it take to release a fix when a critical defect is detected? Top performing teams average less than one hour between when a critical issue is detected and when there is a release that is made that deploys a fix for it.
linkSetting up Time Until Defect Repair on GitClear
Unlike “Release Cycle Time” and “PR Merge Cycle Time,” the MTTR measurement does not factor in business hours. For example, if a bug is filed at 12:00pm that is marked as a critical defect per Critical Defect Tracking setup, and a fix for the defect is released (as detected by Repo Release settings) the next day at 9am, then that defect would be calculated to have been repaired in (21 hours / 24 hours) = 0.875 days.
linkInterpreting your GitClear “Time Until Defect Repair” measurement
A defect is designated to have been “repaired” when a commit, PR or branch references an issue that was designated to be a critical defect, and the commit with that work is subsequently released. For example, if a critical defect is submitted to Jira at 12pm, a fix is authored at 9am, and that fix is deployed at 12pm the following day, then the “Time Until Defect Repair” would be exactly 1.0 days.
Time Until Defect Repair does not consider issue status, since developers are unreliable in the time that they will change a bugs’ status to “Resolved” relative to when that resolved work is deployed. Note this metric does not consider a defect “repaired” until the final commit that references it. So if, in the above example, subsequent to the 12pm release, another commit follows at 3pm that is released at 5pm, then the “Time Until Defect Repair” would be recalculated as 1.2 days after having previously been calculated as 1.0 days.