If you would like to review a summary of Google's December 2024 State of Devops report, click here to read our summary, including 25+ graphs from Google in their most comprehensive software developer intelligence research to date. |
Google DORA ("DevOps Research and Assessment") is a set of software metrics and benchmarks that can be used to categorize an organization's DevOps performance from "Low" to "Elite." Started by a team of software researchers in 2014, DORA was originally a research firm that produced annual reports titled "State of DevOps" (ex: 2018 State of Devops). Research conducted by the team between 2014 and 2018 was subsequently coalesced to author what would become the canonical text on high-performing DevOps, Accelerate. Shortly after publishing Accelerate, in late 2018, the DORA team was acquired by Google.
In this document, we will focus on describing the "foundational four" Google DORA stats, offering suggestions how to get the stat measured on GitClear, and show an example of what you'll get once the chart is set up. What we will not describe in this document are the additional DORA stats GitClear tracks beyond the "foundational four," nor will we digress into how we chose the units for each of these DORA metrics. If you have the appetite to dive even deeper into how GitClear's DORA stats can help your team, check out our Google DORA in detail: precise definitions, specific units and examples help page. It also has several more screenshots of GitClear DORA-related charts.
You might also be curious about our individual Defect Browser, for those that want to dig deeper than a chart.
linkRecommended DORA Instrumentation: Via Notifications
As you learn about the Google DORA stats below, you may wonder: "Do I really have to go review these charts every day/sprint?" Most managers, especially CTOs and VPs of Engineering, are too busy to repeatedly visit a graph. That's why GitClear focuses on providing numerous "Google DORA Goals" that let you define a threshold & a callback for when and how you should be notified if a particular metric goes too far from its desired value.
For example, if the team hasn't deployed a release in the past week, you can set up an automated notification sent to the #developers Slack channel, prompting developers to consider wrapping up their recent changes so those can be delivered to customers. Or, if a critical defect has been lingering for 10 days, you could set up a goal that sends a Slack notification to the channel and send an email to your project manager.
Bottom line: You don't have to constantly visit the DORA tab in order to get great data. Choosing a few DORA goals, combined with enabling Slack and configuring resource notifications.
linkWhy DORA?
What is it about the DORA metrics that has captured the attention of Google and thousands of other software businesses? We observe three key reasons that DORA gets chosen over other software metrics:
Founded from years of research. DORA's credibility starts with the academic background of its Founders. From the description of Accelerate on Amazon: "Through four years of groundbreaking research from the State of DevOps reports, Dr. Nicole Forsgren, Jez Humble, and Gene Kim measure software delivery performance―and what drives it―using rigorous statistical methods."
Correlated with Enterprise success. Metrics like "Availability" and "Deploy Frequency" might be less important to a startup than the raw speed at which their repo is evolving. But for larger companies, prone to getting mired in bureaucracy, ensuring that their software continues to be released frequently is of paramount importance.
Specific benchmarks to gauge performance. Possessing a set of specific, highly-researched numbers allows companies to categorize their performance as "Low," "Medium," "High" or "Elite." Other software metrics (e.g., "Lines of code" or "Commit count") are too variable between companies to assign a value for what constitutes "Low" or "Elite" performance.
linkIs Your Team's Performance Low, Medium, High, or Elite?
The payoff for almost 10 years of research on comparative DevOps performance? A trove of benchmarked stats, allowing any company to assess how their DevOps performance compares to industry leaders:
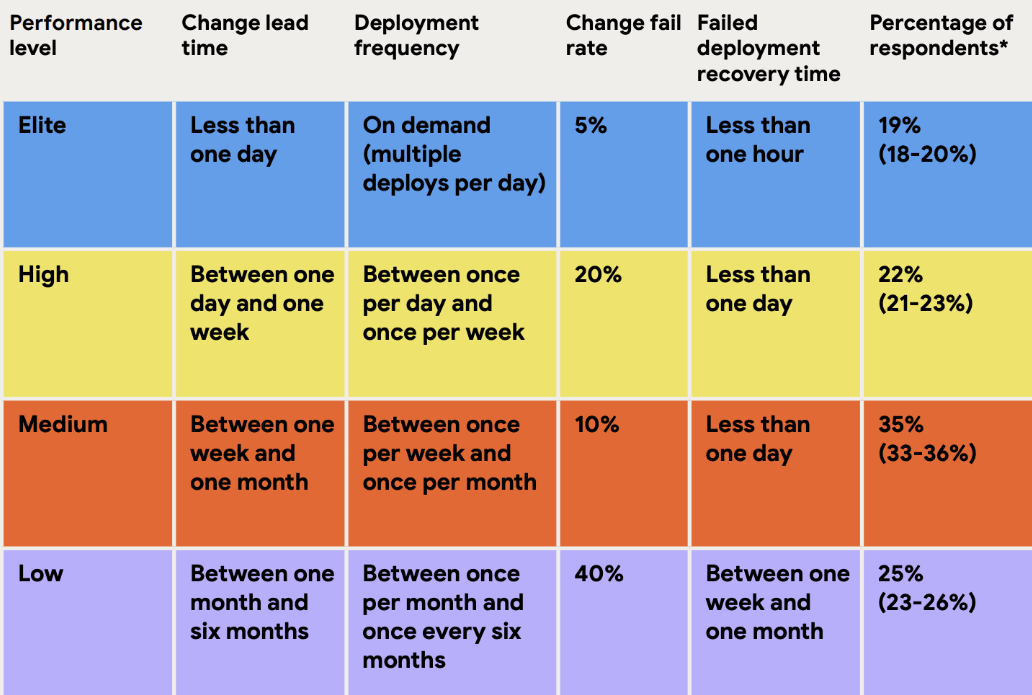
Details from Google on the four critical DevOps metrics show various performance thresholds as they stood in 2024
One interesting wrinkle in the DORA stats is how they re-measure these benchmarks from year-to-year. As you can see in the tables below, 2020 and 2022 yielded identical benchmarks, while 2024 changed things up a bit. 2022 did not publish an "Elite" tier, but since their "Low" and "High" tiers matched, it seems reasonable to infer that the Elite tier is probably about what it had been? In 2024, they did include distinct "Elite" and "High" tiers, but we stuck to using "High" to match the past years' label.
link"High" Performance by Year
Metric | 2020 | 2022 | 2024 |
Deployment frequency | Multiple per day | Multiple per day | Between once per day and once per week |
Lead time for changes | One day to one week | One day to one week | Between one day and one week |
Time to restore service | Less than one day | Less than one day | Less than one day |
Change failure rate | 0-15% | 0-15% | 20% |
Let it not be said that Google will be thorough in their measurement, even if it means deriving the same values every year. Here were the full Google DORA classic stats data from 2024
link"Low" Performance by Year
Metric | 2020 | 2022 | 2024 |
Deployment frequency | 1-6 months | 1-6 months | 1-6 months |
Lead time for changes | 1-6 months | 1-6 months | 1-6 months |
Time to restore service | 1 week to 1 month | 1 week to 1 month | 1 week to 1 month |
Change failure rate | 46-60% | 46-60% | 40% |
Low performance hasn't changed thus far during the "age of AI."
linkThe Four Pillars of DORA
While Google and the DORA team reevaluate their metrics and benchmarks each year, for several years they have settled on the same four metrics as the basis for high performing DevOps teams: Deployment Frequency, Lead Time for Changes, Time to Restore Service, and Change Failure Rate. This section will delve into the definition for each, and how a team can benchmark its own performance.
link🚢 1. Deployment Frequency
The first stat they recommend tracking and optimizing is “release frequency.” Google considers this the most fundamental metric, as “releases” or “deployments” are the underpinning of all four DORA metrics. This makes sense — if you are not shipping code to production regularly, improving that opens the door to faster cycle time and repair time.
According to Google’s benchmarking, an Elite team will make a release of their product "On demand," or at least once per day.
linkSetting Up Release Tracking on GitClear
Our Release tracking setup page describes your options for tracking the frequency of your repo releases. The short version is that, if you mark a deploy by pushing a git tag, you're handled by default. ✅ Otherwise, you can designate a release by any of 1) a regular expression match of a commit message 2) a push to a release or similar-named branch 3) POST to the GitClear Releases API endpoint.
linkRelease Frequency Graph
When you visit the "DORA" tab, you'll see "Release Frequency" among the top-listed stats on the page. If you have the default team selected & your entity has 5+ teams, releases will be segmented by team name. Otherwise, release count will be grouped by repo name.
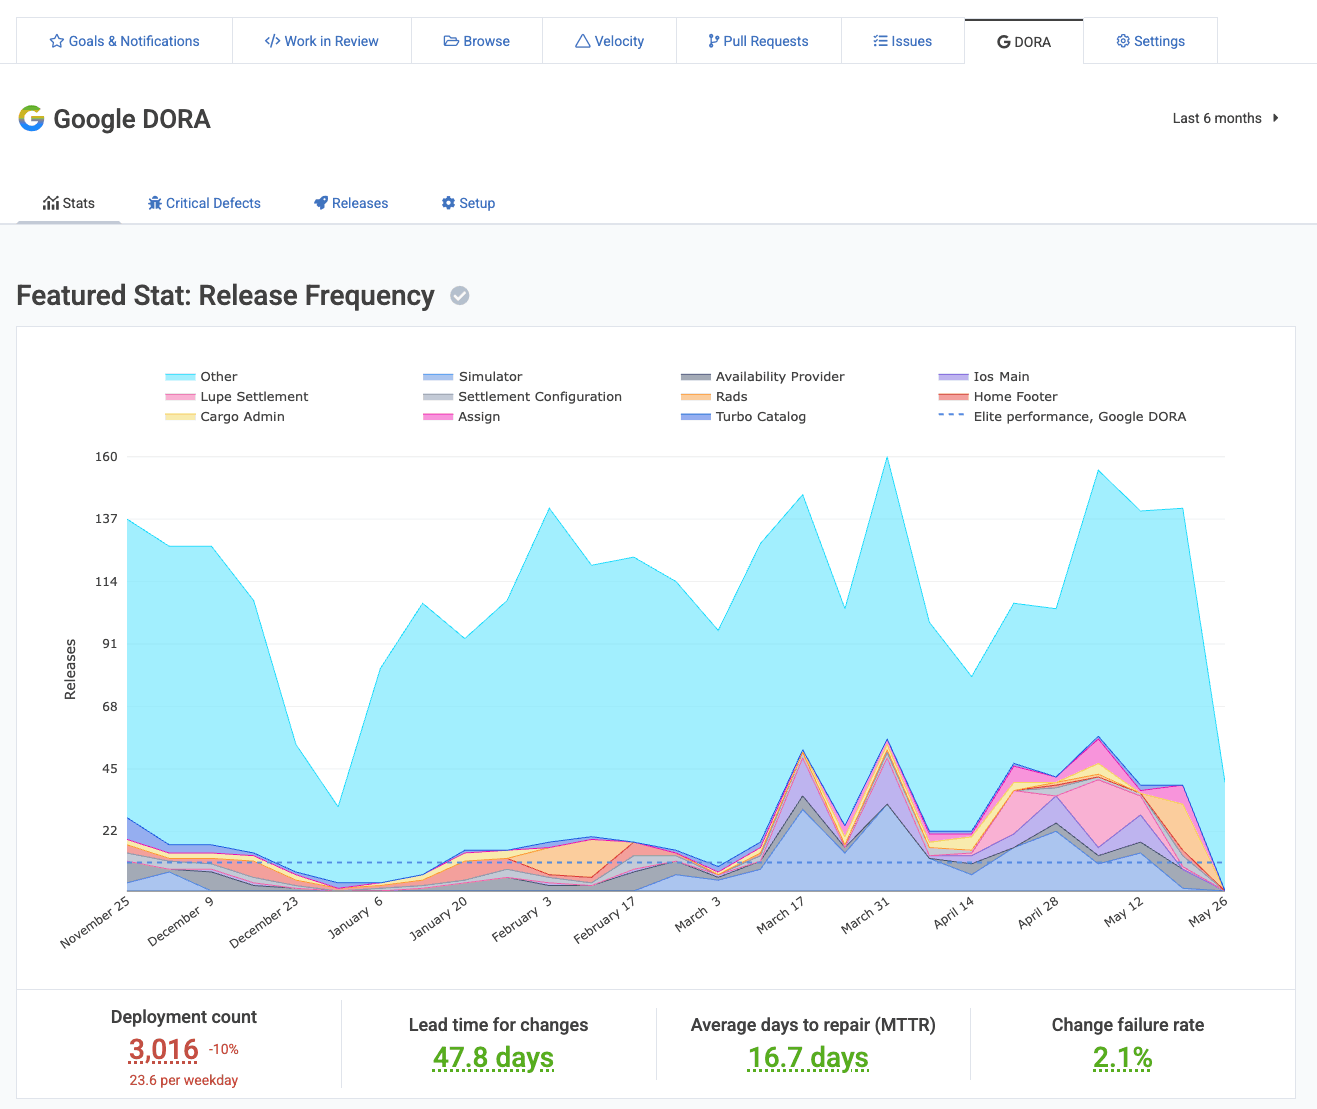
In this screenshot, we show the full context of the DORA page, where aggregate stats are shown below the chart. Subsequent charts won't show these aggregate numbers, but they will be present alongside any graph chosen as the "Featured Graph" on the DORA stats page. A "Featured Graph" is a graph that has had its title clicked.
In terms of applying Google’s release frequency benchmark to your own real world team, our recommendation for simplicity is to strive to make one release per day per team. This heuristic can't work for every team, but to the extent it provides incentive to automate the deploy & testing process, it is an aspiration worth pursuing.
link⏩ 2. Lead Time for Changes ("Change Lead Time")
How many business days does the team average between when work on an issue begins, and when it is released to production? Top performing teams can complete this process in less than one day. 😮
linkSetting up "Change Lead Time" measurement on GitClear
Assuming that you set up Release Tracking using the instructions from the previous section (again, docs here), tracking Lead Time only requires connecting to your issue tracker (e.g., Jira). Since about a third of GitClear's stats rely on issue tracker data, it's worth the 1 minute to complete the Jira oauth.
linkInterpreting your GitClear “Change Lead Time” Graph
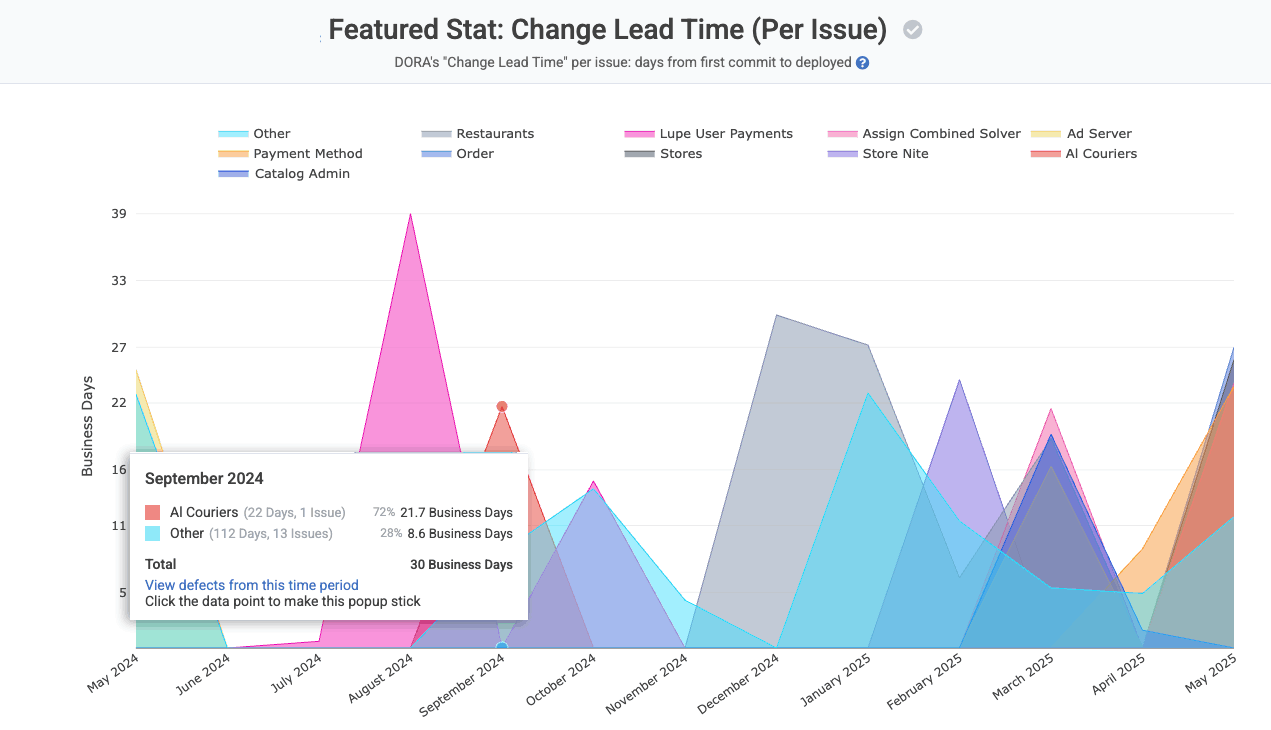
View the number of business days between when work on an issue begins, and when that work is subsequently deployed to a production server
Change Lead Time is calculated in business hours (or business days, if it's more than ~20 hours). For example, if a developer from your team begins work on an issue at 12pm in their time zone, and a final release of that work takes place at 9pm the same day, we would calculate that issue as having a Change Lead Time of 0.6 days, reflecting that 5 business hours passed between when the developer began work on the commit (12pm their time zone) and when that work was released (5 business hours later, since business days end at 9pm, and in the developer's time zone, the time between 5-9pm was non-business hours).
As with the other DORA graphs shown on this page, this graph is grouped (segmented) by team if you have the default team selected, and there are more than 5 teams with data. Otherwise, the Change Lead Time data is grouped by repo.
If you hover a date to see the details on the changes for that time period, you'll receive a link you can use to browse the specific defects that were ongoing during the time period in question.
link🐛 3. Change Failure Rate (aka "Release Percent with Defect")
This metric captures how often a release includes a fix for a defect that was deemed “critical” or "hotfix-worthy." The highest performing teams have critical defects found in less than 15% of their releases, according to Google. Some strategies Google recommends to reduce defect releases:
Thorough testing: preferably automated, but otherwise via QA. The best-case outcome when a defect is introduced? That it will be found before a product release delivers it to customers. An effective continuous integration testing strategy gets bugs detected faster... before the point of 💩-meet-world.
More frequent releases. The more time passes between releases, the more difficult it becomes to prove that an undetected failure hasn't slipped through.
"What gets measured improves." It's a cliche for a reason. The act of making your defect release percentage transparent proves to the team that this data point is a cornerstone of your strategy.
linkSetting up Change Failure Rate aka "Release Percent with Defect" on GitClear
If you set up the prior two metrics, your "v1 setup" is covered! ✅ "Change Failure Rate" is, in a sense, merely the intersection between "Release Tracking" and "Issue Tracking."
While a "v1 setup" is generally sufficient to derive Change Failure Rate, sophisticated customers can follow the "golden path" to track this stat: POST to the Releases API endpoint. The Create Release endpoint is ideal for tracking Change Failure Rate stat because you get a parameter to specify one or more "issues" or "critical defects" considered "resolved" by the release. When we have your direct interpretation of "which releases resolve which issues," the precision of Change Failure Rate and Change Lead Time gets substantially higher.
linkInterpreting your GitClear “Defect Release Percentage” measurement
The “Defect Release Percentage” that we show in the “DORA” tab illustrates the percentage of releases intended to resolve a critical defect.
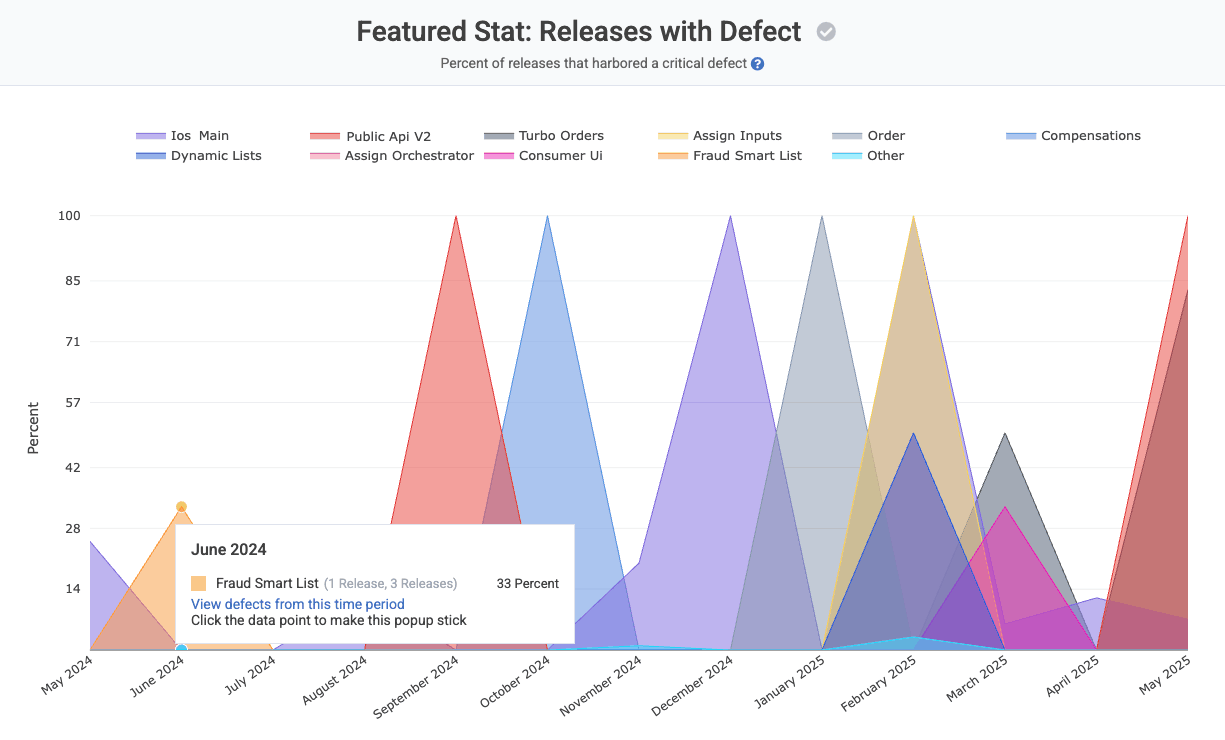
Note that a critical defect can span multiple repos (for example an “API” repo and a “front-end” repo). If two repos made releases that contained the same critical defect, it will be counted as "two defects resolved" from the standpoint of the “Releases with Defect” calculation. It should not impact accuracy of the percentage returned, since the "Releases with Defect" rate is always calculated per-repo (given that every release is intrinsically per-repo).
This report will group by team or repo, depending on factors described in the previous section.
link🏥 4. Time to Restore Service (MTTR)
How many days does it take to release a fix when a critical defect is detected? Top performing teams average less than one hour between when a critical issue is detected and when there is a release that is made that deploys a fix for it.
linkSetting up "Time Until Defect Repair" on GitClear
Assuming you have connected to Jira, GitClear will automatically detect "Time until Critical Defect Repair" by calculating the time that elapses between when a "Severe" or "Critical" Priority issue is opened, and the time it is deployed (as calculated by Release Stats). GitClear will also, by default, catalog an issue as a Critical Defect if the issue mentions being a "hotfix."
If you have a different field in Jira that designates that an issue should be considered a "critical defect," you can choose your defect field under Settings => Issue Tracker Projects.
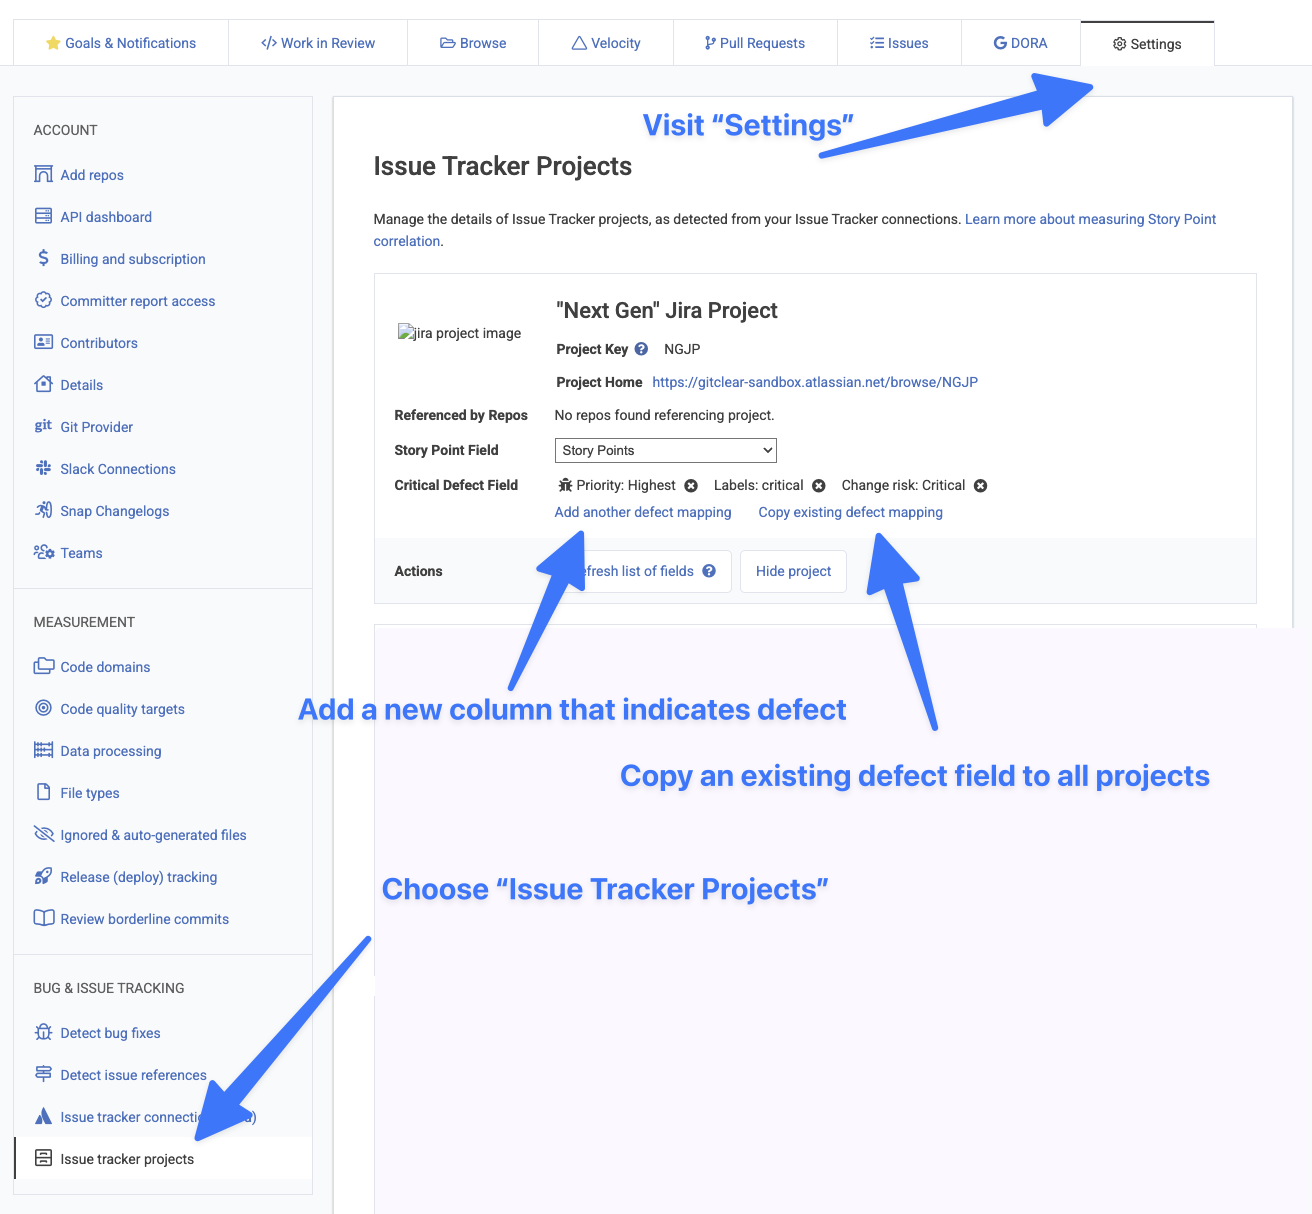
Designating which field means Critical Defect
For teams with an Internal Development Platform, the API also offers endpoints for Creating a Defect, Resolving a Defect, or Resolving a Defect During Release.
linkInterpreting your GitClear “Time Until Defect Repair” measurement
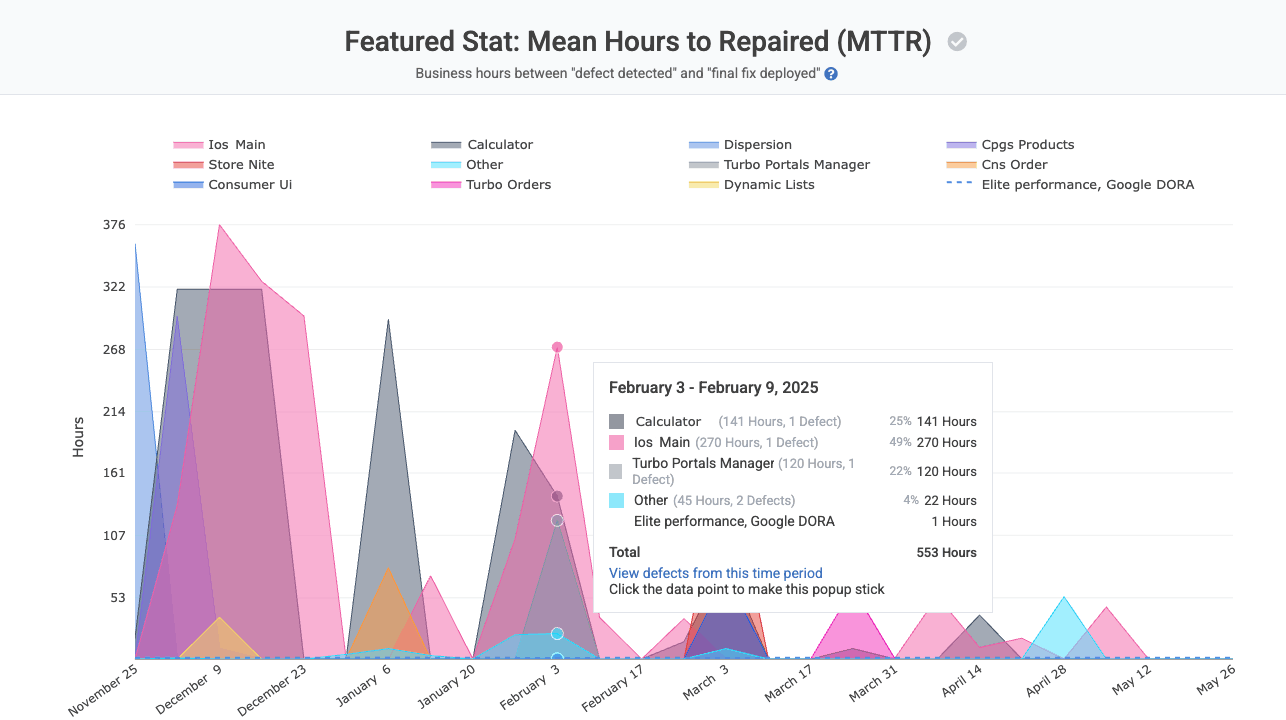
"Mean Hours to Repair" measures business hours between when defect detected and when its resolution is deployed. Grouped by team or repo.
A defect is designated to have been “repaired” when a commit, PR or branch references an issue that was designated to be a critical defect, and the commit with that work is subsequently released. For example, if a critical defect is submitted to Jira at 12pm, a fix is authored at 9am, and that fix is deployed at 12pm the following day, then the “Time Until Defect Repair” would be exactly 1.0 days.
Time Until Defect Repair does not consider issue status, since developers are unreliable in the time that they will change a bugs’ status to “Resolved” relative to when that resolved work is deployed. Note this metric does not consider a defect “repaired” until the final commit that references it. So if, in the above example, subsequent to the 12pm release, another commit follows at 3pm that is released at 5pm, then the “Time Until Defect Repair” would be recalculated as 1.2 days after having previously been calculated as 1.0 days.