The "Activity Stats" tab within our "Pull Requests" section offers our collection of pull request stats built to inform Managers and Leads about how their team is charting over weeks, months, or years.

The default featured graph in "Activity Stats" shows the sum of days that pull requests were opened for label. You can change the featured graph by clicking the title of any of the secondary charts shown below this featured chart
The default featured Pull Request graph shows which of your pull requests have been lingering the longest over the given time interval. The reason this was chosen as the default is that it is a best practice to close pull requests (ie: your Open to closed time) within 2-4 days of their having been opened. By stacking the number of days that each of the longest-open pull requests have lingered, this graph creates a clear visual indicator of how large their pull request backlog sits at, thus helping to reduce their Cycle Time (read more about how we calculate that below!). Best practices for overall cycle time vary, but we generally recommend keeping this within a single sprint (so generally 1-2 weeks).
The featured graph can be changed by clicking on the subsequent graphs that reside in the following section. Those subsequent graphs include:
linkLingering Pull Requests
The default chart shown indicates the biggest pull requests that are lingering (aka "open for more than 10 business days or your chosen lingering interval") are present within each repo:

Don't let work go to waste...! Make sure that pull requests get closed by periodically reviewing Lingering Pull Requests
This chart ensures that the team does not forget about work that is underway, even when that work is taking a long time to finish its review.
linkDiff Delta by Pull Request Stage
Diff Delta by PR stage shows how much work went into 1) Preparing the Pull Request 2) Revising the Pull Request 3) Polishing the PR after merge.
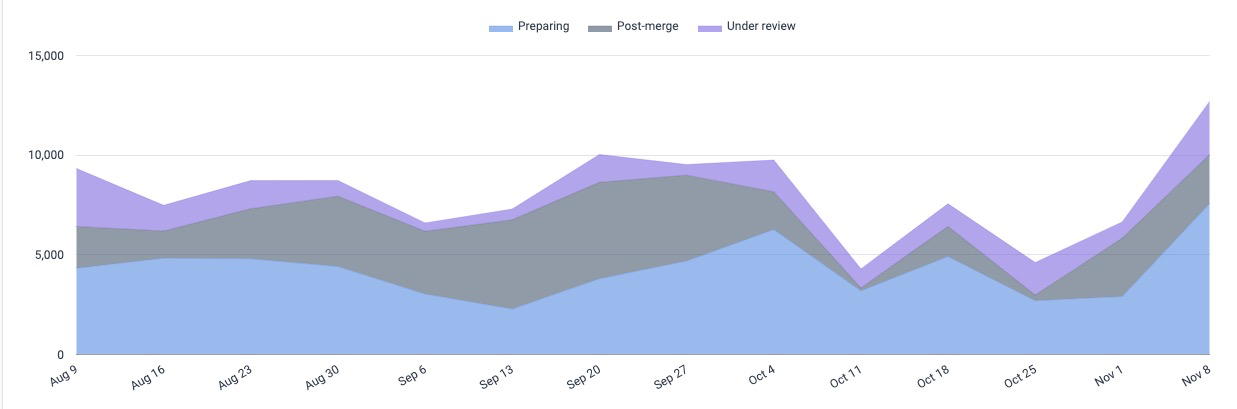
Upon clicking the title for the chart, it becomes the featured chart, which reveals its labels and date range
In general, the more time that the team is spending in the Before PR Submitted state, and the less time they are spending in the Post-merge (i.e., adjusting already merged work) state, the happier the developers. We recommend that 90% of work be focused on Before PR Submitted Diff Delta, 10% or less focused on Under Review Diff Delta, and 1% or less focused on Post-Merge Diff Delta.
linkPull Request Cycle Time
This graph shows how, over time, the interval has changed between when the first commit is made toward a pull request, and that pull request is merged into the main branch.
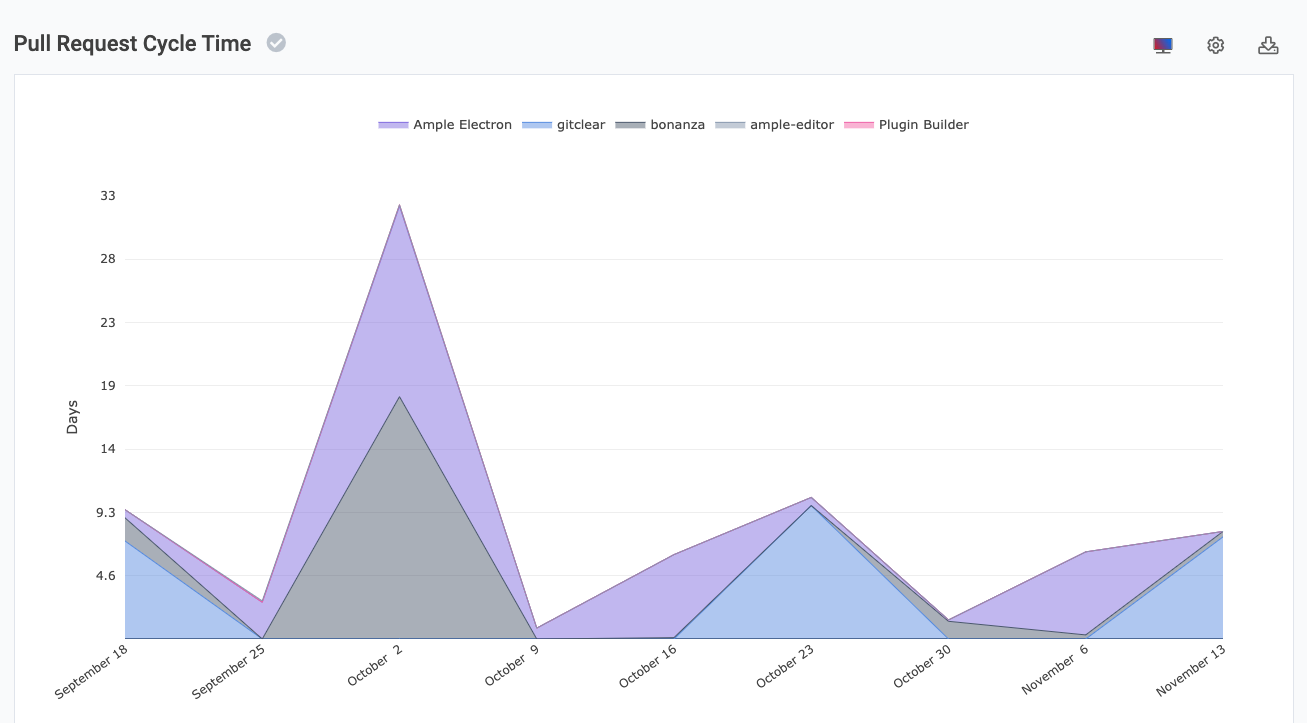
How long did it take for a pull request to be completed after the developer started work? Segmented by repo when looking at an organization or entity.
The date for each data point represents the average of all pull requests that were closed during the date interval. In the graph above, the interval chosen is a few months, so each date represents one week of time.
So, in the graph above, the spike in "Pull Request Cycle Time" that is seen for the week of October 2nd indicates that the average pull request that was closed within the gray (= "Bonanza" repo) segment, between October 2nd and October 8th, took 18 weekdays from the time of first commit, to when the pull request was merged.
linkComments left
You can also track the number of comments left over time, giving you a barometer for how much feedback is being passed to your developers during the review stage. In general, less is better.

How much conversation has been happening in pull requests?
It's most common that the "Comments Left" graph will spike when new contributors are being added to the team, and are learning conventions. Focusing on consistent, updated documentation can go a long way toward driving down the review time => comment count that is required to get new developers fully assimilated to team best practices.
linkAverage Weekdays Open for Review
How long is it taking for pull requests to move through the review process? This graph tells the story:
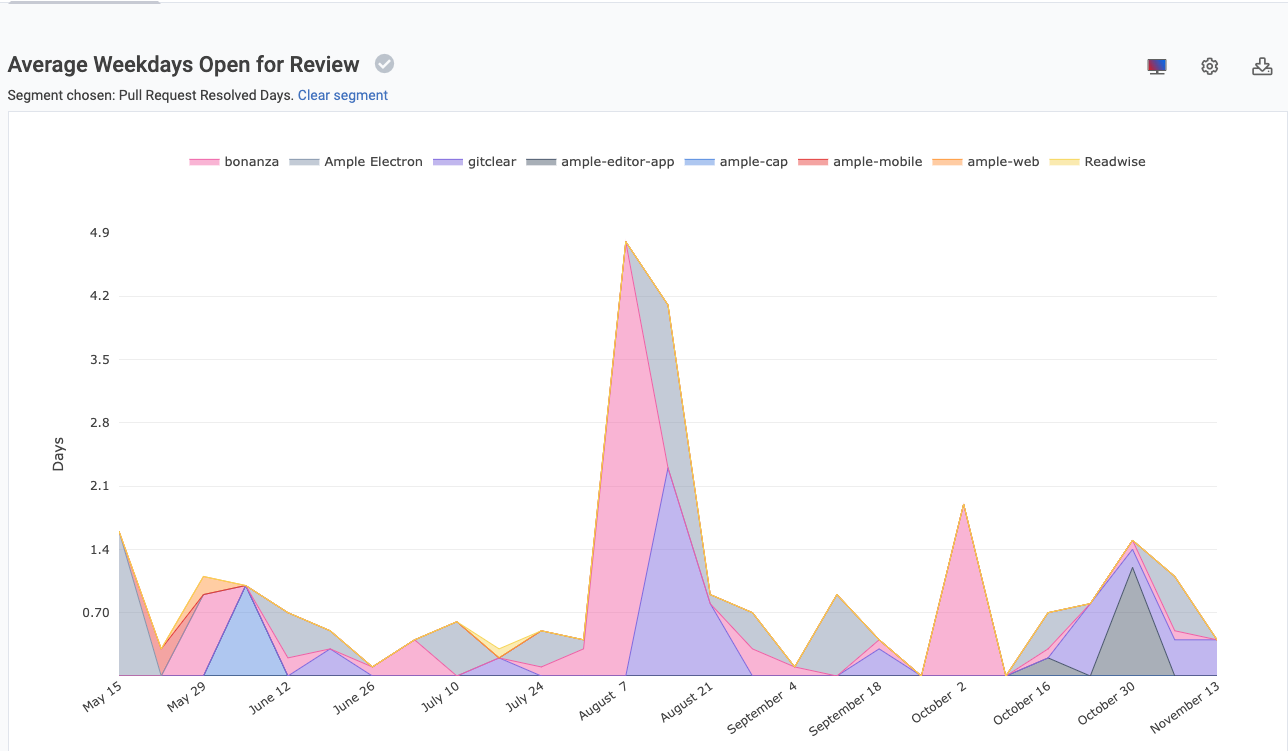
How many weekdays was the average pull request opened for before it was merged? Data separated by repo
Most teams aim to keep their pull request review to under 3 business days.
linkPull Request Stat boxes: Cycle Time, Open-to-Closed time, Diff Delta per PR, and more
Beneath the featured graph, we show five boxes that answer common questions posed by managers and developers:
When navigating your own data, each stat will offer more information on how it was calculated upon being hovered
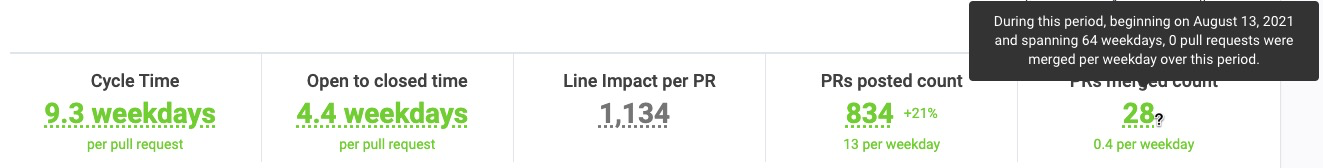
According to Google DORA and others, Cycle Time should be one of the primary metrics that a team seeks to reduce in pursuit of being able to respond more quickly once they decide what they want to work on. Hovering on the tooltip for Cycle Time will reveal the data that we used to calculate this stat, so you're not left in the dark wondering about which data was used for the calculation. "Cycle Time" in the context of the Pull Request stats means "how much time passed between the first commit for the PR and when it was merged."
Open to closed time illustrates the average duration of time between when a pull request was opened for review and when it was closed. Teams usually want this to be considerably shorter than their Cycle Time, otherwise that indicates that most of the time for the PR is being spent in the PR review process. We recommend this being within 1 or 2 days.
Diff Delta per PR gives a manager a sense for whether the team is succeeding in pursuit of submitting small, easily digestable pull requests. By default, GitClear suggests that most pull requests should be 500 Diff Delta or less, since the average contributor accrues around 100-200 Diff Delta per day, implying that a PR of greater than 1,000 Diff Delta was probably worked on longer than a week, which gets to be a lot of code to review. Managers can configure their own target value for "Diff Delta per PR" in their settings.
PRs posted count. How many pull requests were opened during the selected time window? In general, this should closely match your expected pace for tickets closed during a given sprint.
PRs merged count. How many PRs were closed in this interval with a status of "merged."